Band 4.0 IELTS Writing Task 1 Model Answer
Overall Band Score: 4.0 · IELTS Summit Mastery · 2026-11-06
IELTS Writing Task 1 question
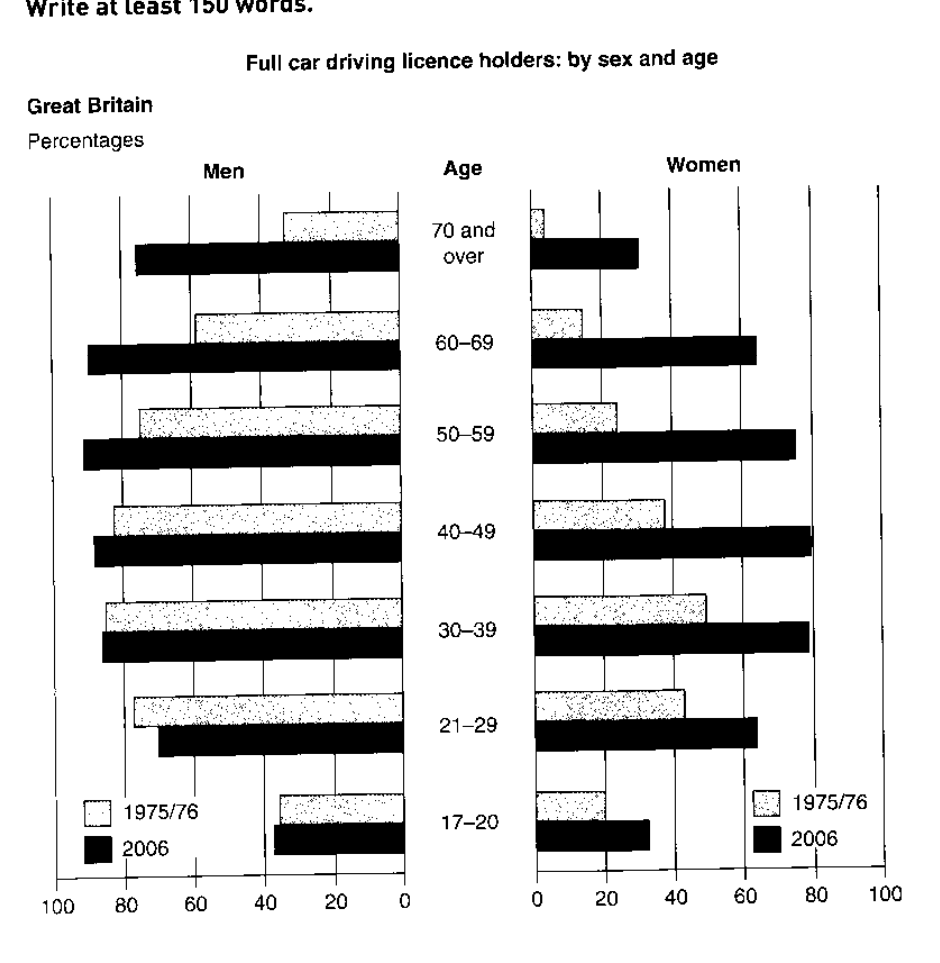
The graphs below show the percentage of people holding full driving licences in Great Britain by age and sex.
Summarise the information by selecting and reporting the main features, and make comparisons where relevant.
Full car driving licence holders: by sex and age
Student answer (Band 4.0)
The bar charts illustrate the percentages of people by age and sex who have full driving licenses in Great Britain.
Overall, men had more driving licenses compared with women. The percentage of driving licenses for middle-aged men and women was higher than other age groups.
Till 50-59 the driving licenses percentage increased for men in 1975/76.
AI examiner evaluation
| Criterion | Band |
|---|---|
| Task Achievement / Task Response | 3.0 |
| Coherence and Cohesion | 4.5 |
| Lexical Resource | 4.5 |
| Grammatical Range and Accuracy | 4.5 |
| Overall | 4.0 |
Task Achievement / Task Response: Band 3.0
You identify the chart’s subject and offer a broad comparison, but the report is far too brief to summarise the main features adequately. The claim that men had higher licence rates than women is generally supported, and you note a rise among men up to ages 50–59 in 1975/76. However, this trend is incomplete: the male figure then falls slightly in the older groups, while in 2006 it peaks around ages 50–59. The statement that middle-aged groups were highest is also too broad, since the peak age differs by sex and year. The response contains only 56 words, below the required 150. Add an overview and select key comparisons across both years, sexes and age groups, supported by accurate figures.
Coherence and Cohesion: Band 4.5
The response has a basic, understandable order: an introduction, an overall statement and one detail about the 1975/76 figures. This gives the reader a simple progression, and the opening clearly identifies what the charts show. However, the final sentence is isolated and does not develop into a comparison with the other age groups, women or 2006. The linking word “Overall” is appropriate, but “Till” does not clearly connect the detail to the overview and makes the sequence feel abrupt. To improve, organise the report into a clear overview followed by paragraphs comparing the two years or the two sexes, and use linking expressions to show contrasts and changes.
Lexical Resource: Band 4.5
You use relevant basic terms such as “percentages,” “age,” “sex” and “middle-aged,” so the topic is recognisable. However, the vocabulary range is narrow, and “driving licenses” is repeated rather than using more precise chart language such as “licence holders” or “licence ownership.” The phrase “the percentage of driving licenses” is also an imprecise collocation: the chart reports the percentage of people holding a licence, not a percentage of licences. Use verbs and phrases suited to describing data, such as “rose,” “declined,” “accounted for” and “was highest among.” More varied, accurate wording would help you report comparisons without repeating the same phrase.
Grammatical Range and Accuracy: Band 4.5
Your sentences are generally understandable, and the opening uses a clear present-tense reporting structure: “The bar charts illustrate…” The overview also attempts a comparison in a complete sentence. However, the response relies almost entirely on short, simple sentence patterns, so it shows little grammatical range. In “Till 50-59 the driving licenses percentage increased for men in 1975/76,” the age phrase is awkwardly placed and the sentence does not clearly express the full trend. Practise combining comparisons with clauses, for example, “Among men, the figure rose to… before falling among older groups.” Check sentence structure and punctuation when adding age ranges and contrasting years.
See this exact question answered at other band scores. The same prompt compared across bands.
Browse more IELTS Writing model answers or get your own writing scored by the same AI examiner.