Band 5.5 IELTS Writing Task 1 Model Answer
Overall Band Score: 5.5 · IELTS Summit Mastery · 2026-11-06
IELTS Writing Task 1 question
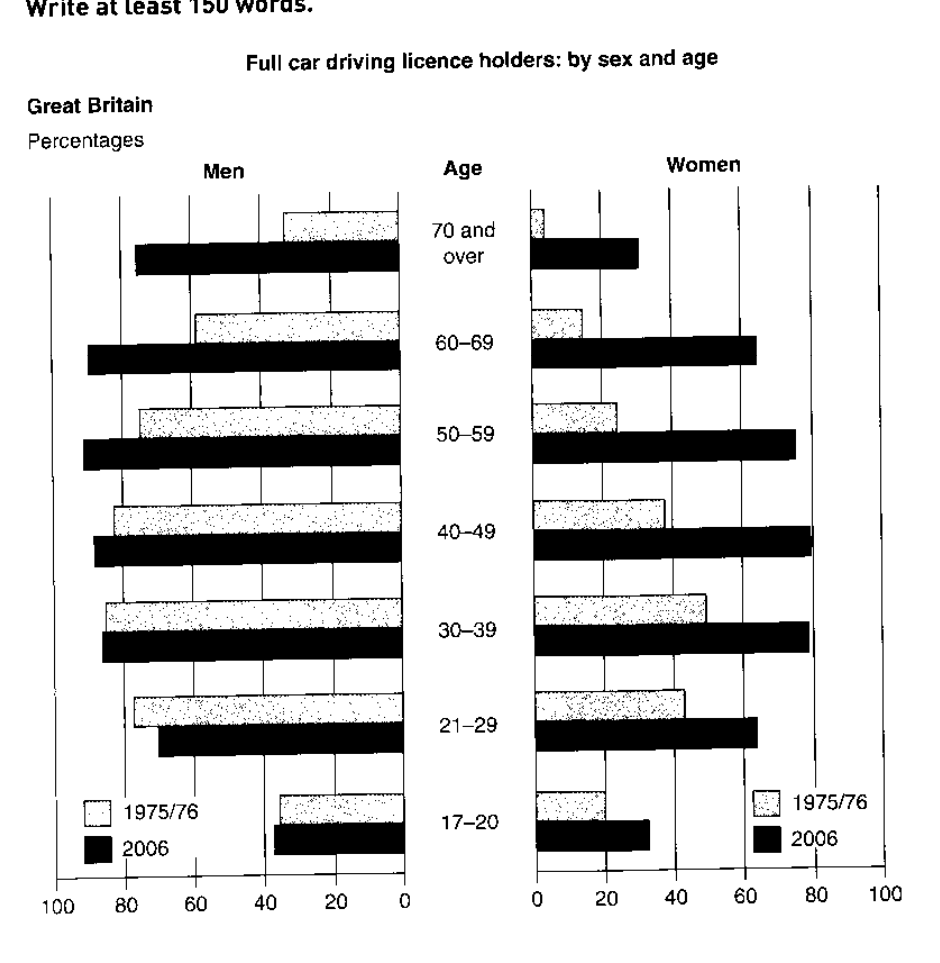
The graphs below show the percentage of people holding full driving licences in Great Britain by age and sex.
Summarise the information by selecting and reporting the main features, and make comparisons where relevant.
Full car driving licence holders: by sex and age
Student answer (Band 5.5)
The bar graph compares the proportion of the citizens of Great britein who holding full car driving licence by sex (men and Women) and seven age groups in 1975/76 and in 2006.
Overall, it is evident that the highest percentage of car driving licence holders were accounted for male, while female who had drivining licence was increased over the period.
Looking at the chart in more detail, it is clear that the largest proportion of male licence holdes increased with increasing time from 1975 to 2006, except for the age group 21-29. The number of people incresed with increasing age as for age groups 17-20 holdes about 36% driving licence in 1975 which was increased bt 1% in 2006, whereasthe highest increased showed in the age groups 70 and over at approximately by 40% from 1975 to 2006, and 31% for the age groups 60-69.
Turning to the remaining category, for women the highest upward trend showed by the 60-69 years old group, which was about 50% from the given period.
AI examiner evaluation
| Criterion | Band |
|---|---|
| Task Achievement / Task Response | 5.5 |
| Coherence and Cohesion | 6.0 |
| Lexical Resource | 5.5 |
| Grammatical Range and Accuracy | 5.0 |
| Overall | 5.5 |
Task Achievement / Task Response: Band 5.5
You identify the broad pattern that men had higher licence-holding rates overall and that women’s rates rose between the two years. You also select some relevant changes, such as the increase among men aged 70 and over and the near-stability among 17–20-year-olds. However, the overview is incomplete: it does not mention that the highest rates in 2006 were generally among middle-aged men, or that women’s largest rise was not confined to one group. The claim that the largest increase for women was among 60–69-year-olds is inaccurate: their rate rose by about 50 percentage points, but the 50–59 group rose by a similar amount and the 40–49 group by about 42 points. Several comparisons are vague or unclear, limiting coverage of the main features.
Coherence and Cohesion: Band 6.0
The response has a recognisable structure: an introduction, an overview, a paragraph about men and a final paragraph about women. This gives the reader a basic route through the information, and phrases such as “Overall” and “Turning to the remaining category” help signal shifts. However, the progression within the men’s paragraph is difficult to follow because several age groups and changes are packed into one long sentence. The phrase “The number of people increased with increasing age” is also unclear and does not accurately guide the comparison. The women’s paragraph is very brief and does not develop the comparison. Use separate sentences to group the largest changes, smaller changes and exceptions, with clear references to the year and age group.
Lexical Resource: Band 5.5
You use some relevant task vocabulary, including “proportion,” “age groups,” “highest percentage” and “upward trend,” so the topic is generally understandable. However, the range is limited and several word choices or collocations are inaccurate, which makes parts of the report awkward: “the highest percentage … were accounted for male” and “the largest proportion … increased with increasing time” do not express the intended comparisons naturally. Spelling errors such as “britein,” “drivining,” “holdes” and “incresed” are noticeable. Aim for precise chart language, especially “the proportion of men holding licences” and “rose by approximately … percentage points.” Check spelling and avoid repeating “increased” when describing different trends.
Grammatical Range and Accuracy: Band 5.0
You attempt both simple and more complex sentences, including a comparison introduced by “except for” and a clause beginning “whereas.” However, complex sentences are often not controlled successfully, and errors sometimes make relationships between figures difficult to understand. For example, “who holding full car driving licence” needs a finite verb form, while “female who had drivining licence was increased” has problems with both clause structure and verb choice. In “the highest percentage … were,” the subject and verb do not agree. The long sentence beginning “The number of people increased…” also contains unclear clause connections and punctuation. Practise accurate sentence patterns such as “The proportion of men aged 70 and over rose from 35% to 77%,” then combine comparisons only when the grammar remains clear.
See this exact question answered at other band scores. The same prompt compared across bands.
Browse more IELTS Writing model answers or get your own writing scored by the same AI examiner.