Band 5.5 IELTS Writing Task 1 Model Answer
Overall Band Score: 5.5 · IELTS Summit Mastery · 2026-11-06
IELTS Writing Task 1 question
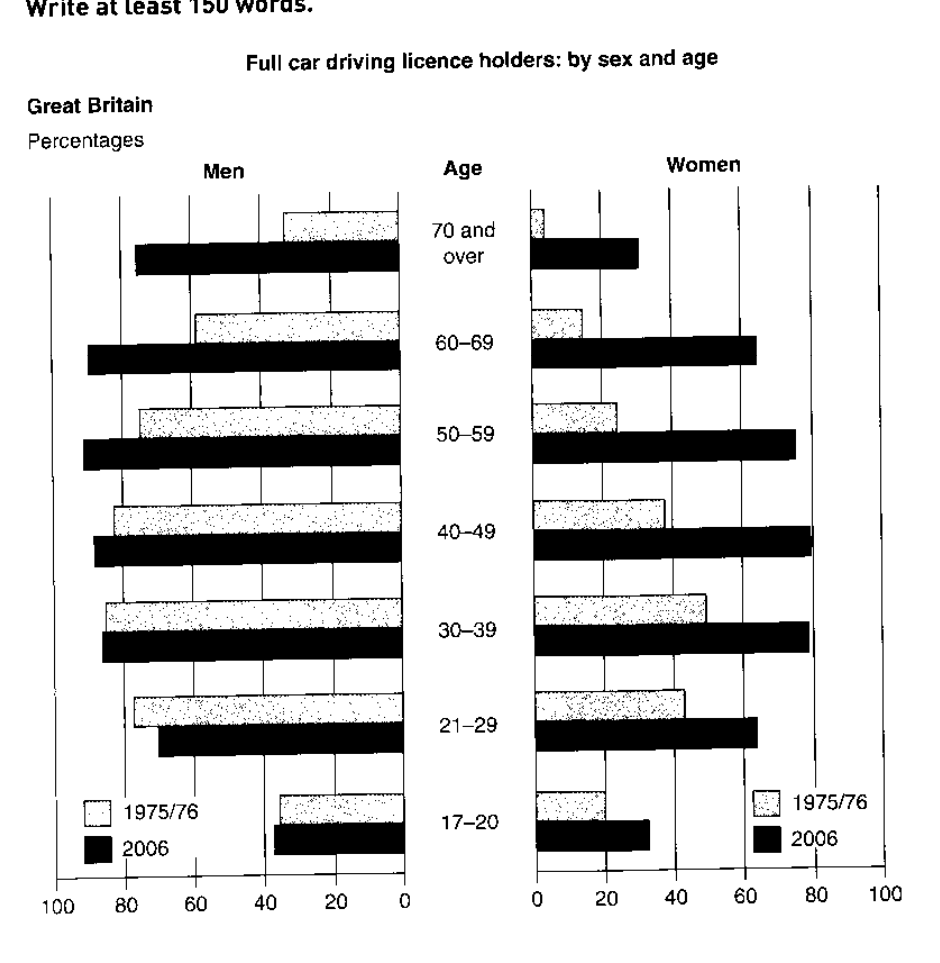
The graphs below show the percentage of people holding full driving licences in Great Britain by age and sex.
Summarise the information by selecting and reporting the main features, and make comparisons where relevant.
Full car driving licence holders: by sex and age
Student answer (Band 5.5)
The charts illustrates people who holds full driving licenses in UK by their age and gender in percentage.
Overall, men are holding more driving certificate than women in almost every years. The people with small age not have license yet. But this count is increase with age. Although it show significant down grade in bigger age group in men. Women display similar kind of behavior but with more decline.
On men side, In 1975/76 increase as age increase but it show more rose in 2006 compared to 1975/76. The amount is stable between age of 40-69 in year 2006 then it became low. MEN amount started with almost similar count in both 1975/76 and 2006.
On women side, in 1975/76 it started with very low count of license holder but in 2006 it was high compared to 1975/76. In 2006, this count increase exponentially till age of 40-49 and then it decline. in 2006 the amount of driving license holder is higher compared to year 1975/76 both.
AI examiner evaluation
| Criterion | Band |
|---|---|
| Task Achievement / Task Response | 5.5 |
| Coherence and Cohesion | 6.0 |
| Lexical Resource | 5.0 |
| Grammatical Range and Accuracy | 5.0 |
| Overall | 5.5 |
Task Achievement / Task Response: Band 5.5
You identify the broad pattern that men had higher licence-holding rates than women and that the 2006 figures were generally above those for 1975/76. However, several key trends are unclear or inaccurate. The claim that licence holding increases with age overlooks the lower figures among the oldest groups, and “people with small age not have license yet” is contradicted by the chart: even among 17–20-year-olds, rates range from about 20% to 37%. Your overview also says there is a significant decline in the older male groups, whereas the 2006 male figures remain high for those aged 60–69 and 70+. To strengthen the response, give a clearer overview and support it with accurate comparisons, such as the especially large rise among older women.
Coherence and Cohesion: Band 6.0
The response has a recognisable structure: an introduction, an overview, and separate paragraphs for men and women. This makes the main categories easy to locate, and phrases such as “On men side” and “On women side” signal the shift in focus. However, progression within the paragraphs is sometimes difficult to follow because trends are described generally rather than compared by age group or year. The overview’s statements about age and decline are also hard to reconcile with the later details. Some linking is repetitive, particularly repeated references to 1975/76 and 2006. Organise each body paragraph around a clear comparison—for example, younger versus older groups—and use precise references to connect the figures.
Lexical Resource: Band 5.0
You use relevant topic vocabulary, including “full driving licenses,” “age,” “gender,” and “decline,” so the subject is generally understandable. However, the range is limited and several word choices or collocations are inaccurate, which makes some descriptions unclear. “Driving certificate” is not the appropriate term for a licence, while “more rose” and “significant down grade” do not express the intended trends naturally. “The amount” is also unsuitable for percentages of people; use “proportion” or “percentage.” Aim for precise chart language and vary verbs such as “rose,” “increased,” “fell,” and “remained stable.” Check spelling and word forms, including “licence” and “holders,” to make the report more accurate.
Grammatical Range and Accuracy: Band 5.0
You attempt both simple and more complex sentences, including a contrast introduced by “Although” and a sentence describing a rise followed by a decline. However, errors in agreement, articles, verb forms, and sentence construction are frequent enough to make parts of the report awkward. For example, “The charts illustrates” should be “The chart illustrates,” and “men are holding” is not a suitable tense for describing the data. The fragment “Although it show significant down grade…” is not a complete sentence, while “this count increase” needs a past-tense verb. Capitalisation is also inconsistent, as in “In” and “MEN.” Practise forming complete past-tense sentences and checking subject–verb agreement before submitting.
See this exact question answered at other band scores. The same prompt compared across bands.
Browse more IELTS Writing model answers or get your own writing scored by the same AI examiner.