Band 6.0 IELTS Writing Task 1 Model Answer
Overall Band Score: 6.0 · IELTS Summit Mastery · 2026-11-07
IELTS Writing Task 1 question
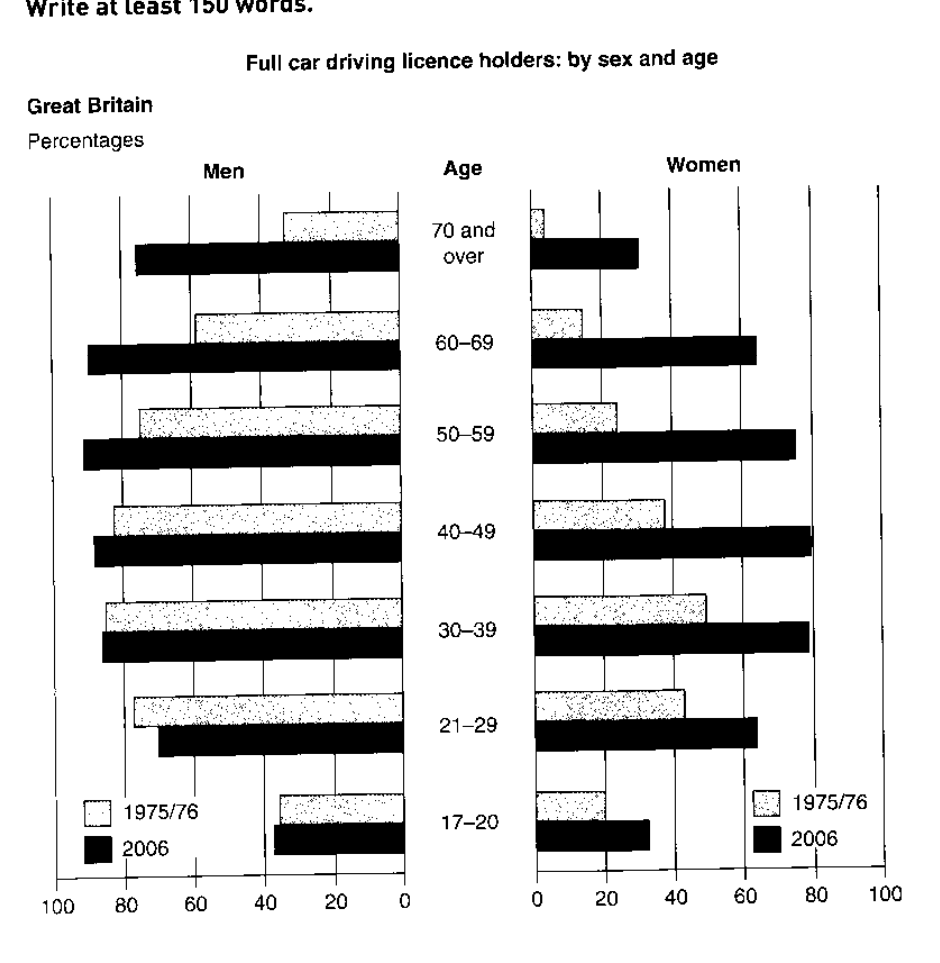
The graphs below show the percentage of people holding full driving licences in Great Britain by age and sex.
Summarise the information by selecting and reporting the main features, and make comparisons where relevant.
Full car driving licence holders: by sex and age
Student answer (Band 6.0)
The bar graphs show the percentage of people holding full driving licences in Britain by age and sex, measured in percentage.
Overall, fifty- to fifty-nine-year-old men had highest figure, while younger males had a lower figure. In contrast, forty- to forty-nine-year-old women had highest percentage of their group, while seventy up had the lowest proportion.
In 2006, men aged 50 to 59 made up the highest proportion (90%), while in 1975/76 it was 75%. In 2006, the percentage of teenagers (17- 20) was 38%, while in 1975/76 that was 35%. Men aged 30-39 showed a similar percentage in 2006and 1975/76: 84% and 82%. However, men over 70, percentage was three-quarters, but in 1975/76 it was 35%.
Women aged 40-49 made the highest figure, 80% in 2006, while in in 1975/76 it was 37%. Teenage women (17-20) showed one-fifth(20%) in 2006 while in 1975/76 it was 35%. Women over 70 had the lowest figure in 1975/76:8% however, in 2006 it was 30%.
AI examiner evaluation
| Criterion | Band |
|---|---|
| Task Achievement / Task Response | 6.0 |
| Coherence and Cohesion | 5.5 |
| Lexical Resource | 6.0 |
| Grammatical Range and Accuracy | 5.5 |
| Overall | 6.0 |
Task Achievement / Task Response: Band 6.0
You provide a clear overview of several important patterns, including the high figures for middle-aged men and women and the low figures among the oldest women. You also compare both years for selected age groups. However, some details are inaccurate: the highest male figure was for men aged 50–59 in 2006 (about 92%), but the 1975/76 figure was about 76%, not 75%—a small difference, while your overview’s claim that younger males had a lower figure is broad and overlooks the particularly low rates among the youngest and oldest groups. More importantly, teenage women rose from about 20% to 33%; the response reverses these years. The overview also misses the broad rise in licence holding among women across age groups. Select and report the main trends more consistently.
Coherence and Cohesion: Band 5.5
The response has a recognisable structure: an introduction, an overview, and separate paragraphs for men and women. This makes the main comparisons easy to locate. However, progression within the detail paragraphs is somewhat list-like, and the comparisons do not always connect smoothly. For example, the paragraph on men moves from ages 50–59 to teenagers, then 30–39 and over-70s without a clear organising principle. Linking words such as “while” and “however” are used, but some transitions are awkward or repetitive, and the final paragraph ends abruptly. Grouping age bands by a shared trend—such as the substantial increases among older groups—would create clearer progression and more effective cohesion.
Lexical Resource: Band 6.0
You use an adequate range of task-related vocabulary, including “percentage,” “proportion,” “highest figure,” and “lowest proportion,” and the meaning is generally clear. There is some variation in how you describe comparisons, but several expressions are imprecise or unnatural: “had highest figure” needs an article, while “made up the highest proportion” is not the clearest way to describe the chart’s percentages. “Seventy up” is also unclear, and “measured in percentage” is an inaccurate collocation. Aim for precise chart language such as “the proportion of licence holders” and “the figure for those aged 70 and over.” This would improve naturalness and accuracy while retaining the useful range already shown.
Grammatical Range and Accuracy: Band 5.5
You attempt a mix of simple and complex sentences, including comparisons with “while” and “however,” and most of the information remains understandable. Some grammatical errors persist, particularly with articles, sentence construction, and punctuation. For example, “men had highest figure” should be “men had the highest figure,” and “Men aged 30-39 showed” needs a clearer grammatical link to the figures that follow. The sentence “However, men over 70, percentage was three-quarters” lacks a complete structure; write, for instance, “For men aged 70 and over, the figure was about three-quarters.” There are also punctuation and spacing problems around figures and clauses. Check each sentence for a complete subject and verb, and use articles consistently.
See this exact question answered at other band scores. The same prompt compared across bands.
Browse more IELTS Writing model answers or get your own writing scored by the same AI examiner.