Band 5.0 IELTS Writing Task 1 Model Answer
Overall Band Score: 5.0 · IELTS Summit Mastery · 2026-11-07
IELTS Writing Task 1 question
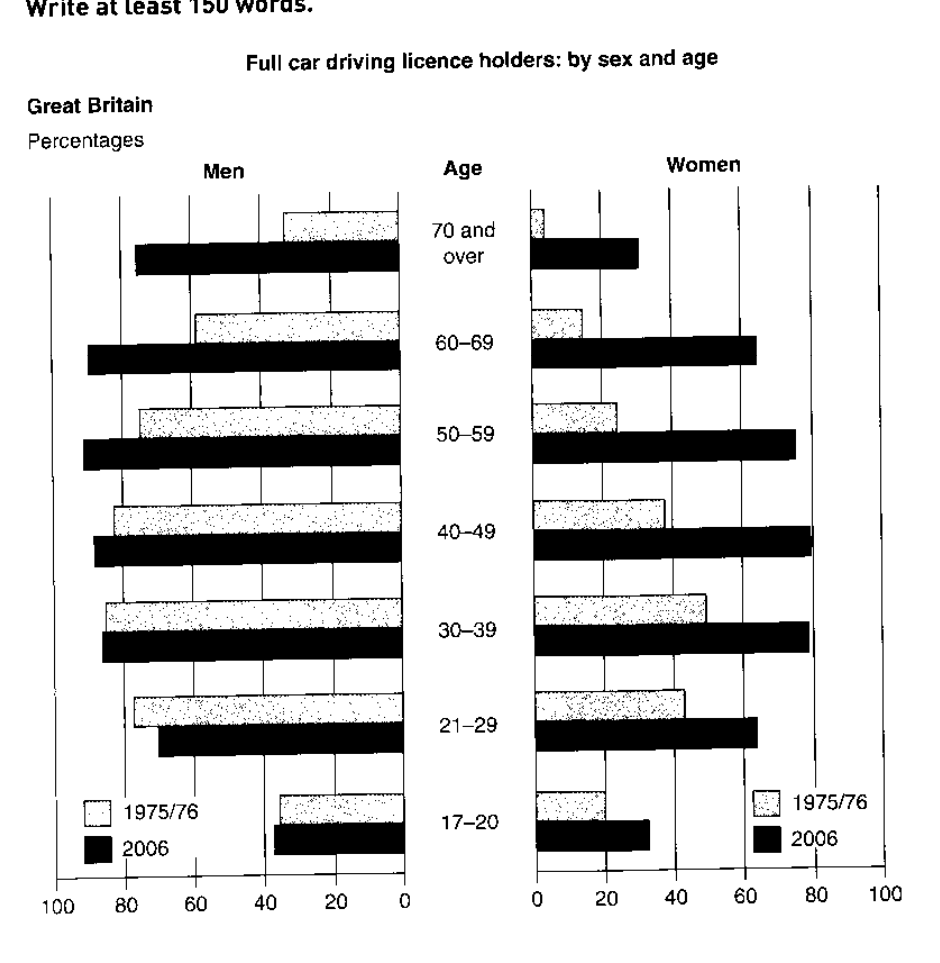
The graphs below show the percentage of people holding full driving licences in Great Britain by age and sex.
Summarise the information by selecting and reporting the main features, and make comparisons where relevant.
Full car driving licence holders: by sex and age
Student answer (Band 5.0)
The ratio of individual by age having full driving licences in the United Kingdom in time period between 1975/76 and 2006 are illustrated in this bar graphs. The data is measured in percentages.
Overall, it is clear that the middle age ratio for having full driving licences is highest among both sexes while the percentage decrease when moving to older age specially in women.
In age 17-20 almost 20 percent women and approximately 336 percent men have license in 1975/76 and it increased in 2006 by the ratio of nearly 25 percent and 38 percent. The major increased shown in middle ages. In age 21-29 the women represent nearly 43 percent and increase almost 20 percent and reached to approximately 63 percent. mens also showed the minor increase of nearly 6 percent firstly it is in approximately 70 percent and reached to almost 76 percent.
In age 30-39 and 40-49 both men and women have the highest ratio to hold the full time driving licence. In first year women are almost 50 percent and men are almost
AI examiner evaluation
| Criterion | Band |
|---|---|
| Task Achievement / Task Response | 5.0 |
| Coherence and Cohesion | 5.0 |
| Lexical Resource | 5.0 |
| Grammatical Range and Accuracy | 5.0 |
| Overall | 5.0 |
Task Achievement / Task Response: Band 5.0
You identify the chart’s subject and give an overview that recognises higher licence ownership among middle-aged groups, as well as an increase over time. You also include several relevant comparisons, such as women aged 21–29 rising from about 43% to 63%. However, the overview is too broad: the highest figures are not consistently in the middle-age groups, and the pattern differs by sex and year. Some figures are inaccurate, including “336 percent” for young men in 1975/76, and the account ends before completing the comparison of ages 30–49 or covering older groups. Select the main trends accurately and support them with a few well-chosen figures.
Coherence and Cohesion: Band 5.0
The response has a basic structure, moving from an introduction and overview to age-group details, and the age bands provide some organisation. However, progression is limited because the comparisons are not developed systematically across both sexes and both years. The final paragraph stops after “men are almost”, leaving an important comparison unfinished and making the ending feel abrupt. Linking phrases such as “In age 21-29” and “In age 30-39 and 40-49” help signal the topic, but connections between points are sometimes unclear, and the repeated focus on individual age bands does not build a complete account. Group the data into clear patterns, such as changes among younger, middle-aged and older people, and use transitions to show contrasts.
Lexical Resource: Band 5.0
You use some relevant chart vocabulary, including “percentage”, “increased”, “middle ages” and “reached”, so the reader can generally identify the topic and direction of change. However, the range is limited and several word choices or collocations are inaccurate, which sometimes makes the meaning difficult to follow. For example, “ratio of individual by age” is not a natural way to describe the figures, and “full time driving licence” changes the meaning of “full driving licence”. The phrase “major increased” also uses the wrong form. Aim for precise, repeated chart language such as “proportion of licence holders”, “rose to” and “the largest increase”, while checking spelling and word forms.
Grammatical Range and Accuracy: Band 5.0
You attempt both simple and more complex sentences, including the overview beginning “Overall, it is clear that…” and comparisons using “while”. However, control is inconsistent, and errors in sentence structure, agreement, articles and punctuation often make the writing difficult to read. For instance, “The ratio … are illustrated” has a subject–verb agreement problem, while “In age 17-20 almost 20 percent women” lacks grammatical links between the age group and the figures. The sentence about men aged 21–29 also combines several clauses without clear punctuation. Practise complete sentence patterns such as “Among women aged 21–29, the figure rose from 43% to 63%,” and check agreement and sentence boundaries.
See this exact question answered at other band scores. The same prompt compared across bands.
Browse more IELTS Writing model answers or get your own writing scored by the same AI examiner.