Band 5.5 IELTS Writing Task 1 Model Answer
Overall Band Score: 5.5 · IELTS Summit Mastery · 2026-11-08
IELTS Writing Task 1 question
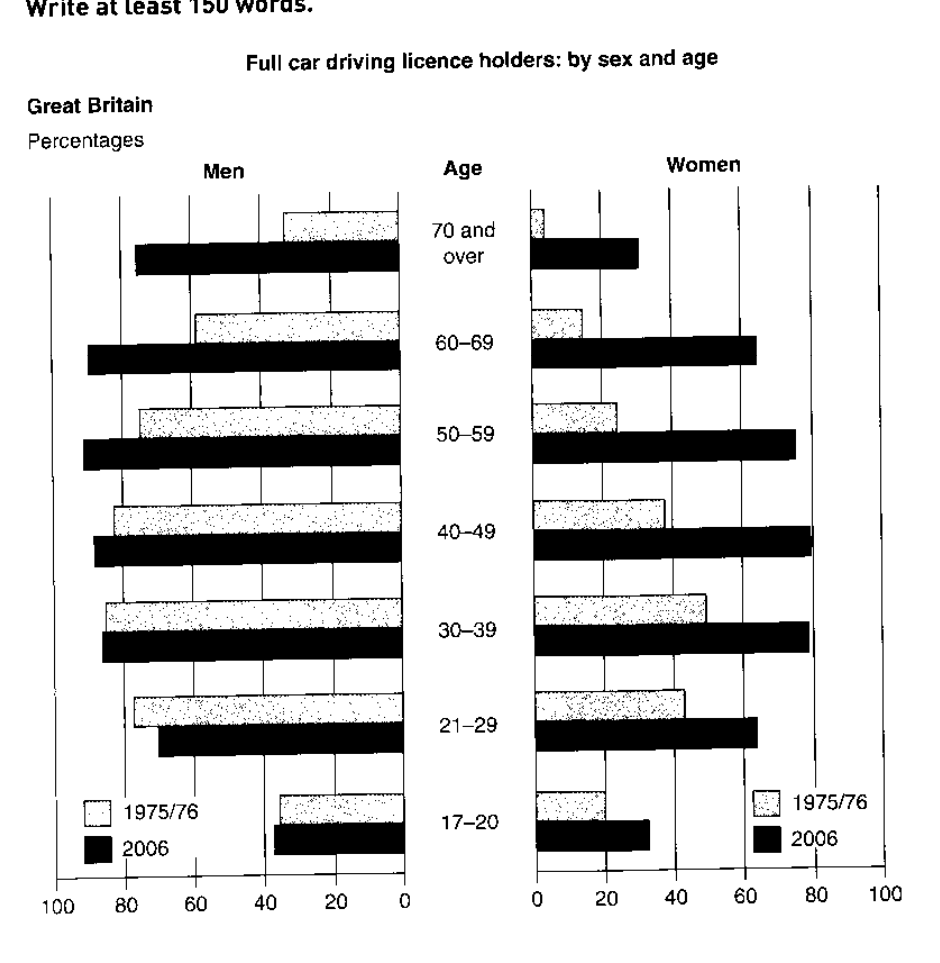
The graphs below show the percentage of people holding full driving licences in Great Britain by age and sex.
Summarise the information by selecting and reporting the main features, and make comparisons where relevant.
Full car driving licence holders: by sex and age
Student answer (Band 5.5)
The figure illustrates the percentage of people who holds full driving licences in Great Britain by two factors which is age and sex in two periods like 1975/76 and 2006.
The percentage counts for men in all durations of age is incresed except in 21-29 from the 1975/76 to 2006, but for women its always counts up for all ages duration that means women in Great Britain holding licences is always increased.
For the men in Great Britain the percentage of holding licences is rising above 80 for 30-69 this age gaps wheres for women its never rose above 80 percentage. Compared to men the percentage is always rose for women in all age gaps for this two years duration. Women in Great Britain at 2006 holding licences higher number than 1976/76 duration. Its also true for men except for 21-29 ages, in that period for men its declined by almost 8%, where for men its always increased by 2-10% but at duration 17-20 and 30-29 ages the number is almost equal where there's no counts for women equally holding licences at both years.
So, holding licences in Great Britain for men and women increased proportionally without one age duration for men, eventally its always rose for women though its not too much compared to men in number.
AI examiner evaluation
| Criterion | Band |
|---|---|
| Task Achievement / Task Response | 5.5 |
| Coherence and Cohesion | 5.5 |
| Lexical Resource | 5.0 |
| Grammatical Range and Accuracy | 5.0 |
| Overall | 5.5 |
Task Achievement / Task Response: Band 5.5
You identify the broad pattern that women’s licence-holding rose in every age group and that men’s figures generally increased, and you note the notable fall among men aged 21–29. However, several comparisons are inaccurate or unclear. Men’s figures did not rise in every age group: the 17–20 group was almost unchanged, at about 36% and 37%, while 21–29 fell from roughly 78% to 70%. The claim that women’s figures “never rose above 80” is broadly consistent, but the statement that men exceeded 80% for ages 30–69 overlooks that the 30–39 figure in 1975/76 was below 80%. The overview also misses the key contrast: men had higher rates overall, while women’s increases were especially marked among older groups. Select and report these main features more precisely.
Coherence and Cohesion: Band 5.5
The response has a basic structure: an introduction, a paragraph describing general trends, and further comparisons followed by a concluding sentence. This gives the reader some sense of organisation. However, progression is limited because the same broad points are repeated, such as women’s figures increasing “for all ages” and the comparison between the two years. Linking phrases including “but,” “Compared to men,” and “So” are used, but some connections are difficult to follow, particularly “Compared to men the percentage is always rose for women.” The final sentence repeats earlier information rather than providing a clear overview. Group the data into meaningful comparisons—for example, overall changes by sex, then age-group exceptions—and use clear references to the relevant year and group.
Lexical Resource: Band 5.0
You use some task-relevant vocabulary, including “percentage,” “licences,” “declined,” and “increased,” so the general subject is understandable. However, the range is limited and several repeated or inaccurate expressions make comparisons imprecise. Phrases such as “counts up,” “holding licences is always increased,” and “age gaps” are not natural ways to describe chart data. “Durations” is also repeatedly used where you mean age groups or periods, and “proportionally” does not accurately describe the overall pattern. Spelling errors such as “incresed” and “eventally” further reduce control. Aim for precise chart language, including “the proportion of licence holders,” “age group,” “rose,” and “remained broadly stable,” and check spelling before submitting.
Grammatical Range and Accuracy: Band 5.0
You attempt longer sentences with contrast and cause, but complex structures are often faulty, and errors occur frequently enough to make some comparisons hard to interpret. For example, “people who holds” has incorrect subject–verb agreement, while “the percentage counts for men … is incresed” has an unsuitable verb construction and tense. The sentence beginning “Compared to men” also lacks a clear grammatical comparison, and “Its also true for men” uses an incorrect apostrophe form. Sentence boundaries and punctuation are sometimes weak, especially in the long sentence beginning “Women in Great Britain at 2006.” Use a reliable pattern such as “The proportion of men aged 60–69 increased from … to …” and check agreement, articles, and past-tense forms.
See this exact question answered at other band scores. The same prompt compared across bands.
Browse more IELTS Writing model answers or get your own writing scored by the same AI examiner.