Band 5.0 IELTS Writing Task 1 Model Answer
Overall Band Score: 5.0 · IELTS Summit Mastery · 2026-11-10
IELTS Writing Task 1 question
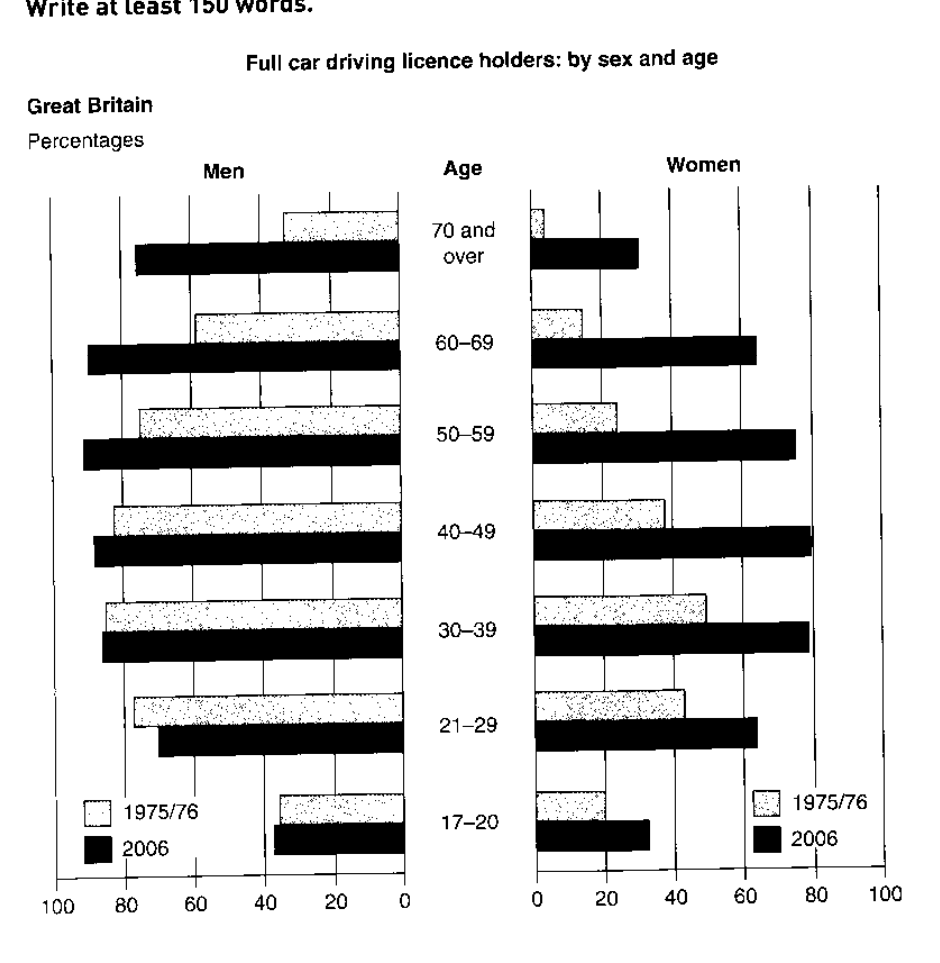
The graphs below show the percentage of people holding full driving licences in Great Britain by age and sex.
Summarise the information by selecting and reporting the main features, and make comparisons where relevant.
Full car driving licence holders: by sex and age
Student answer (Band 5.0)
The following graph represents or shows the percentage of people holding full driving licences in Great Britain by age and sex and we can see that females in their teenage have higher percentage rate for holding a car driving lisence then male teenagers, but later in oldage the percentage drops heavily in womens than men.
The white bar clearly shows that in 90s the women were not driving the car as men, this could have been because of how women were treated in the early ages and their rights and all, but as generations change the lifestyle too.
In the middle age of both men and women from 25 to 70 both percentage is almost same and the major difference we can see is in the teenage and the oldage. Men hold the driving lisence more in overall than women but and its obvious that men has to go to the work for the family and most of the women used to stay home for their work and this could be the another reason for this.
AI examiner evaluation
| Criterion | Band |
|---|---|
| Task Achievement / Task Response | 5.0 |
| Coherence and Cohesion | 5.0 |
| Lexical Resource | 5.0 |
| Grammatical Range and Accuracy | 5.0 |
| Overall | 5.0 |
Task Achievement / Task Response: Band 5.0
You identify the broad contrast between men and women and note that the gap is especially large among older people, which is relevant to the chart. However, the response only partially reports the data: it does not clearly compare the two years or describe the main age patterns across the groups. The claim that teenage women had a higher rate than teenage men is inaccurate for both years, and “in 90s” does not match the chart, which compares 1975/76 with 2006. The explanation about women’s rights and men working is speculation rather than information shown by the graph. To strengthen the summary, give an accurate overview and support it with selected comparisons, such as the rise in women’s licence-holding across most age groups.
Coherence and Cohesion: Band 5.0
The response has some organisation: it begins by introducing the chart, then discusses a perceived historical difference, and ends with a comparison between age groups. However, the progression is not consistently clear, and the paragraphs do not build a focused summary of the visual. Connections such as “but later” and “as generations change” are vague, while the final sentence combines a comparison with an unsupported explanation. Repeated references to “men,” “women,” and “percentage” also make the writing feel repetitive. A clearer structure would use an overview paragraph followed by one or two paragraphs comparing the years and age groups, with precise linking phrases such as “By contrast” and “In 2006.”
Lexical Resource: Band 5.0
You use some relevant vocabulary, including “percentage,” “middle age,” and “major difference,” so the topic is generally understandable. However, the range is limited and several choices are inaccurate or informal for an academic chart summary. “White bar” is unclear because the chart uses bars for different years, and “in 90s” misidentifies the period. There are also noticeable spelling errors, including “lisence,” “oldage,” and “womens,” alongside awkward phrases such as “percentage rate” and “go to the work.” Use precise chart language to describe proportions, age groups, and changes, and avoid explanations that are not supported by the visual.
Grammatical Range and Accuracy: Band 5.0
You attempt longer sentences using conjunctions such as “but,” “as,” and “because,” but these complex structures are often faulty, and the range of sentence patterns remains limited. For example, “both percentage is almost same” has problems with number agreement and article use, while “men has to go to the work” has subject–verb and article errors. The opening sentence is also overloaded, making its comparisons difficult to follow. Punctuation and sentence boundaries need more control, particularly where several ideas are joined in one sentence. Practise writing shorter, accurate comparison sentences first, then combine ideas using well-controlled clauses.
See this exact question answered at other band scores. The same prompt compared across bands.
Browse more IELTS Writing model answers or get your own writing scored by the same AI examiner.