Band 5.0 IELTS Writing Task 1 Model Answer
Overall Band Score: 5.0 · IELTS Summit Mastery · 2026-11-11
IELTS Writing Task 1 question
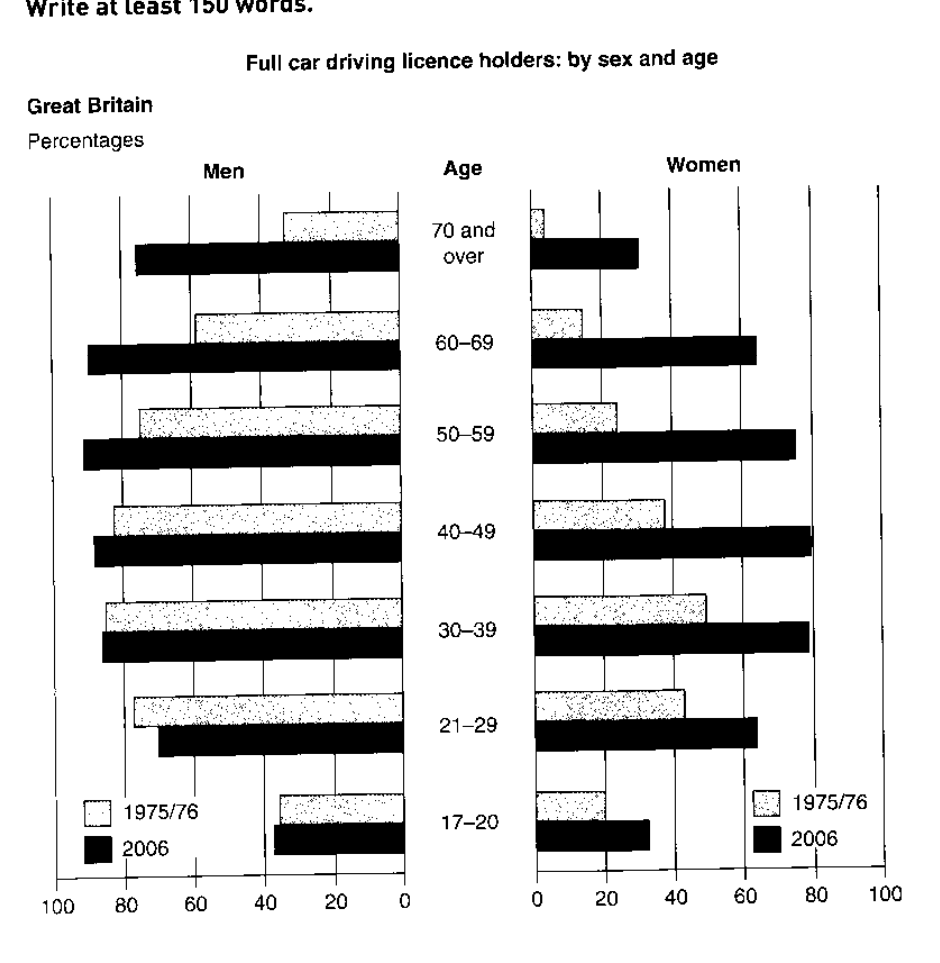
The graphs below show the percentage of people holding full driving licences in Great Britain by age and sex.
Summarise the information by selecting and reporting the main features, and make comparisons where relevant.
Full car driving licence holders: by sex and age
Student answer (Band 5.0)
The graph illustrates the proportion of people holding a full driving license in Great Britain by age and gender.
Overall, in the age group between 50 to 59 your old generation has the most license holders among other age groups. As for females, a 40-49 years old age group owns the most license holders. For instance male drivers hold more driver licenses than female vehicle drivers.
Age group between 17 to 20 your old man individuals, only 38% own certified license. On the other hand, female drivers own 31%.
As for older people, who are 70 and over, female drivers have 30% driver licence holders. However, male drivers approximately hold 80%.
Female drivers in Great Britain start to lose their driver licence when they reach an age group of 50 to 59, but male drivers start losing when their age hits 70 and above.
AI examiner evaluation
| Criterion | Band |
|---|---|
| Task Achievement / Task Response | 4.5 |
| Coherence and Cohesion | 5.0 |
| Lexical Resource | 5.0 |
| Grammatical Range and Accuracy | 5.0 |
| Overall | 5.0 |
Task Achievement / Task Response: Band 4.5
You identify the chart’s subject and make an attempt at an overview, noting that men generally have higher licence-holding rates and that the highest figures differ by sex. However, the overview is inaccurate: men’s peak is around 50–59 in 2006, but women’s highest rate is around 40–49 in 2006, not necessarily across both years. The claim that women “start to lose” licences from 50–59 is also misleading; the figures fall after the 40–49 peak, while men’s rates vary by age and year rather than simply declining after 70. Only the youngest and oldest groups are described, leaving most age bands and the substantial changes between 1975/76 and 2006 unreported. The response is also six words below the required minimum. Include a clearer overview and compare the two years across more age groups.
Coherence and Cohesion: Band 5.0
The response has a basic structure: an opening, an overview, and separate comments on younger and older people. Linking phrases such as “Overall,” “On the other hand,” and “However” help signal relationships between points. However, the progression is limited: the discussion jumps from a broad overview to the youngest group, then the oldest, and finally returns to a general claim about age-related decline. The final paragraph does not clearly follow from the preceding comparisons, and there is little organisation around the two years shown in the chart. Some references, such as “your old generation,” also make the intended age group difficult to follow. Grouping the data into age ranges or comparing 1975/76 with 2006 would create a clearer sequence.
Lexical Resource: Band 5.0
You use some relevant vocabulary, including “proportion,” “age group,” “approximately,” and “license holders,” so the topic is generally recognisable. However, the range is limited and several expressions are inaccurate or unnatural, which sometimes makes the meaning harder to understand. For example, “your old generation” is not an appropriate way to describe an age band, and “own certified license” does not naturally express the percentage of people holding a licence. “Vehicle drivers” and repeated forms of “driver licence holders” are also unnecessarily wordy. Use precise chart language consistently, such as “licence holders,” “the proportion of men/women,” and “the rate rose/fell.” Check spelling conventions too: the chart uses British English, so “licence” is appropriate as a noun.
Grammatical Range and Accuracy: Band 5.0
You attempt a few different sentence patterns, including contrast clauses with “On the other hand” and “However,” and most of the basic message can be understood. Nevertheless, the range is limited, and errors in sentence construction and agreement occur often enough to affect clarity. In “in the age group between 50 to 59 your old generation has,” the age phrase is not formed correctly and the subject is unclear. “Female drivers start to lose their driver licence when they reach an age group” also has an awkward grammatical pattern; people do not “reach” an age group in this way. Practise accurate comparative sentences, for example, “The proportion of women rose to a peak among those aged 40–49, then fell in older groups.” This would also help you report trends more clearly.
See this exact question answered at other band scores. The same prompt compared across bands.
Browse more IELTS Writing model answers or get your own writing scored by the same AI examiner.