Band 4.0 IELTS Writing Task 1 Model Answer
Overall Band Score: 4.0 · IELTS Summit Mastery · 2026-11-11
IELTS Writing Task 1 question
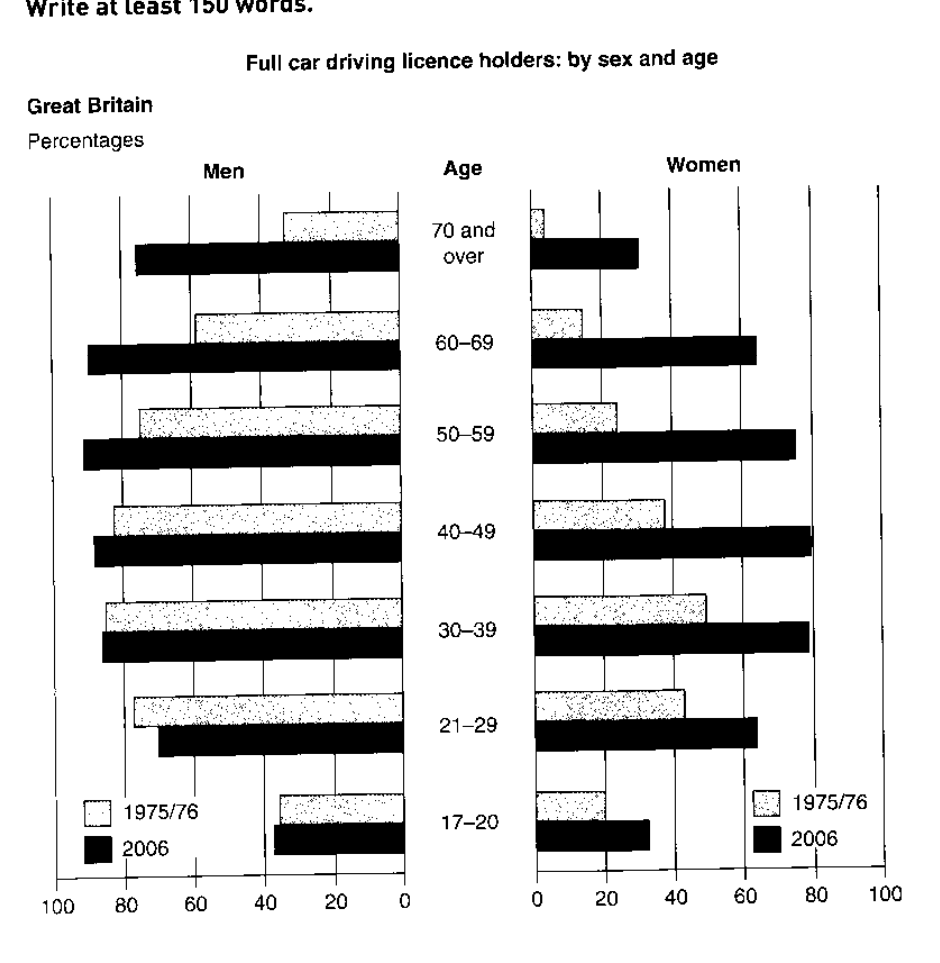
The graphs below show the percentage of people holding full driving licences in Great Britain by age and sex.
Summarise the information by selecting and reporting the main features, and make comparisons where relevant.
Full car driving licence holders: by sex and age
Student answer (Band 4.0)
The graph illustrates the percentage of people having full driving licences in britian by age and sex.
Overall,in 1975 most of the men and women in 30-39 had a driving license while in 2006 most of men in age bracket of 50 to 69 had a license while women in 40 to 49 had a full driving license.
AI examiner evaluation
| Criterion | Band |
|---|---|
| Task Achievement / Task Response | 3.0 |
| Coherence and Cohesion | 4.5 |
| Lexical Resource | 4.5 |
| Grammatical Range and Accuracy | 4.5 |
| Overall | 4.0 |
Task Achievement / Task Response: Band 3.0
The response identifies the chart’s subject and attempts an overview by comparing the two years and sexes. However, it reports only a small part of the information and does not describe the main overall pattern: licence holding rose substantially among women across most age groups, while men already had higher rates in 1975/76. The claim that most men and women aged 30–39 held licences in 1975/76 is inaccurate for women (about 49%, not a majority). The 2006 comparisons are also incomplete, and no supporting figures are given. At 58 words, the response is well below the required 150, leaving the task substantially unfinished. Include a clear overview and several accurate comparisons across age groups and years.
Coherence and Cohesion: Band 4.5
The response has a basic, recognisable structure: an introductory sentence is followed by an overview beginning with “Overall”. This gives the reader a simple route into the topic. However, the answer ends after that overview, so there is no developed sequence of details or comparisons. The long overview sentence also combines several comparisons without clearly separating the years and sexes, and the repeated spacing around words makes the presentation less controlled. To improve, use a short introduction, a distinct overview, and one or two body paragraphs organised by sex or by age pattern. Linking phrases such as “By contrast” and “Meanwhile” can help make the comparisons explicit.
Lexical Resource: Band 4.5
The vocabulary is sufficient to identify the topic and make a basic comparison, using phrases such as “percentage”, “full driving licences” and “age bracket”. However, the range is narrow, with “driving license” repeated, and some wording is imprecise or unnatural, particularly “most of the men and women in 30-39 had a driving license”. Use standard chart language such as “licence holders”, “the proportion of women”, and “the 30–39 age group”. The spelling “britian” should be corrected to “Britain”; in British English, use “licence” as the noun. A wider set of accurate terms for increases, differences and age groups would make the report more precise.
Grammatical Range and Accuracy: Band 4.5
The response communicates its basic meaning through simple sentence structures, including “The graph illustrates…” and an overview sentence beginning “Overall”. However, the range is very limited, and the overview contains several grammatical control problems: “in 1975 most of the men and women in 30-39” lacks a clear age-group construction, while “most of men” is missing a determiner. The phrase “while women in 40 to 49 had” also needs a more complete and parallel structure. Capitalisation and spacing around punctuation are inconsistent. Practise building comparisons with parallel clauses, for example, “In 2006, the highest proportion of male licence holders was among those aged 50–59, whereas the peak for women was in the 40–49 group.”
See this exact question answered at other band scores. The same prompt compared across bands.
Browse more IELTS Writing model answers or get your own writing scored by the same AI examiner.