Band 6.0 IELTS Writing Task 1 Model Answer
Overall Band Score: 6.0 · IELTS Summit Mastery · 2026-11-11
IELTS Writing Task 1 question
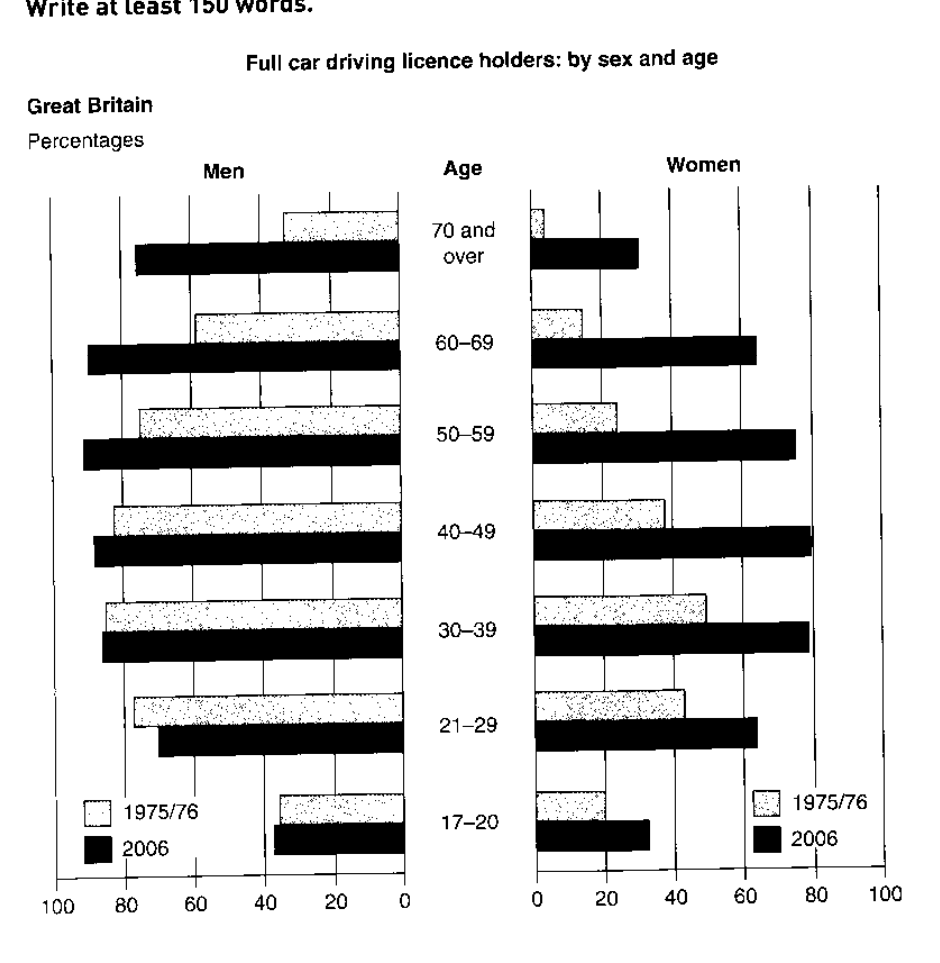
The graphs below show the percentage of people holding full driving licences in Great Britain by age and sex.
Summarise the information by selecting and reporting the main features, and make comparisons where relevant.
Full car driving licence holders: by sex and age
Student answer (Band 6.0)
The bar graph illustrates the proportion of individuals having full driving licences in Great Britain according to their age and gender.
Overall, the two bar graphs compare the number of people in specific age groups reported with full car driving licence based on their genders. Both men and women in 2006 used to have increased numbers of licences compared with the year 1975/1976.
Graph showing men's trends of passing the driving test is more likely than the women. It started with the age of 17-20, which shows around 40% of men hold a driving licence. Then the percentage of people surged till the age of 50-59, where the number drops to 90%. The elderly men aged 70 and over became less interested in acquiring the licence.
On the other hand, only 20 percent of people have seen holding a licence in women at the age of 17-20 in the year 1975/1976, which rose to 30% in 2006. It shows parabolic curve with fewer people interested in holding the licence in the age of 70 and over.
AI examiner evaluation
| Criterion | Band |
|---|---|
| Task Achievement / Task Response | 5.5 |
| Coherence and Cohesion | 6.0 |
| Lexical Resource | 6.0 |
| Grammatical Range and Accuracy | 5.5 |
| Overall | 6.0 |
Task Achievement / Task Response: Band 5.5
You identify the chart’s subject and make a relevant overall comparison, noting that licence holding increased between the two periods for both sexes. However, the overview is imprecise: it refers to “increased numbers” rather than percentages and does not capture the main age pattern. The account of men is also inaccurate: the figures do not rise steadily to ages 50–59, and the 2006 value there is about 92%, not 90%; the older-men comment about being “less interested” is unsupported by the chart. The women’s paragraph gives only the youngest-age comparison and a vague description of a “parabolic curve,” leaving most age groups and the substantial increases among older women under-reported. Select and compare key figures more accurately and develop the overview.
Coherence and Cohesion: Band 6.0
The response has a recognisable structure: an introduction, an overview, and separate paragraphs for men and women. This gives the reader a basic route through the information. However, progression within the body is not consistently clear. The men’s paragraph moves from the youngest group to ages 50–59 and then to the oldest group without explaining the intervening figures, while the women’s paragraph jumps from the youngest group to the oldest. Phrases such as “On the other hand” signal contrast, but the comparison is not developed across corresponding age groups. Use a clearer sequence, such as moving from youngest to oldest, and connect the two sexes through direct comparisons. More precise references would also make it clearer which year and group each statement concerns.
Lexical Resource: Band 6.0
You use an adequate range of task-related vocabulary, including “proportion,” “age groups,” “percentage,” and “compared with,” so the topic is generally clear. There are also attempts at more descriptive language, such as “surged” and “parabolic curve,” but these are not always accurate or natural for describing the chart: the figures do not show a simple surge to the stated age group, and “parabolic curve” is not a suitable description of these separate bars. Phrases such as “used to have increased numbers of licences” and “people have seen holding a licence” are awkward collocations. Prefer precise chart language such as “the proportion rose” or “licence holders accounted for.” This would improve clarity and help distinguish percentages from numbers of licences.
Grammatical Range and Accuracy: Band 5.5
You attempt a mix of simple and more complex sentences, including the overview sentence beginning “Both men and women…” and the contrast introduced by “On the other hand.” Meaning is usually recoverable, but some grammatical errors and awkward constructions reduce precision. For example, “people … reported with full car driving licence” has an unclear grammatical relationship, and “Graph showing men's trends … is more likely than the women” is not a well-formed comparison. In “It started with the age of 17-20,” the pronoun reference is unclear, while “the number drops” shifts tense and does not clearly identify the subject. Use complete, direct clauses with consistent past-tense reporting, and check articles and number agreement—for example, “the proportion of men aged 17–20 was about 36%.”
See this exact question answered at other band scores. The same prompt compared across bands.
Browse more IELTS Writing model answers or get your own writing scored by the same AI examiner.