Band 5.5 IELTS Writing Task 1 Model Answer
Overall Band Score: 5.5 · IELTS Summit Mastery · 2026-11-12
IELTS Writing Task 1 question
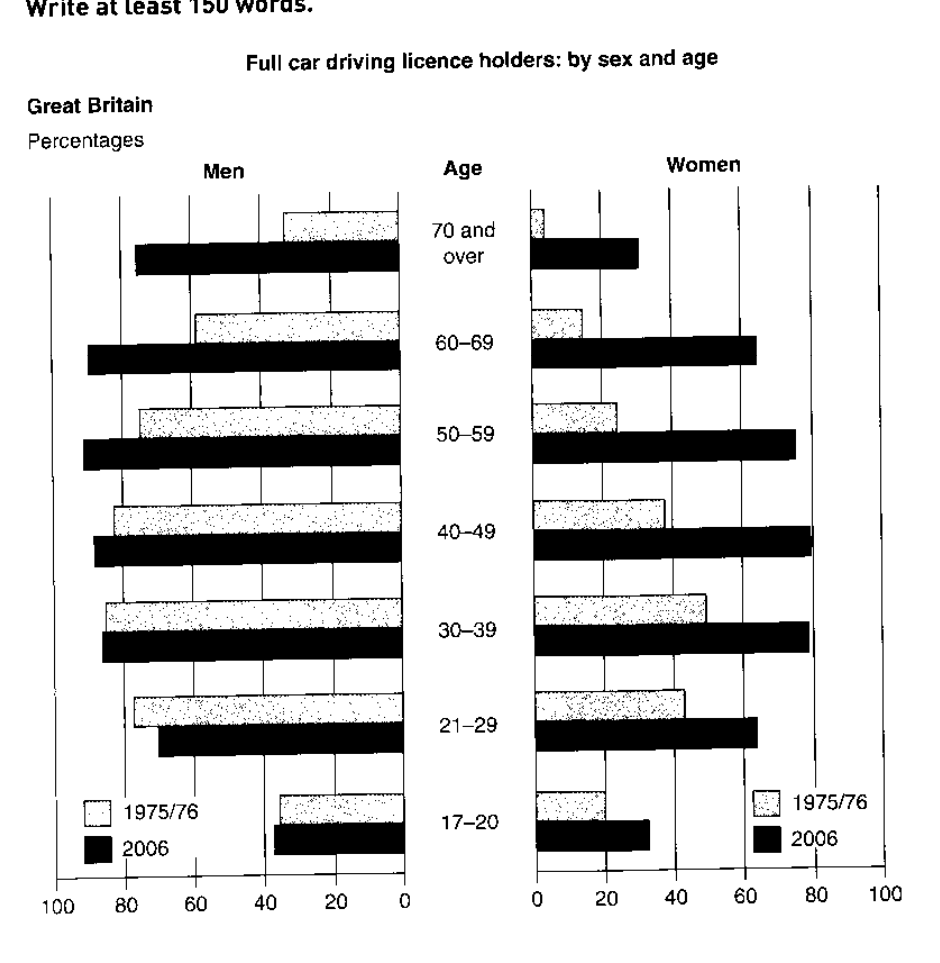
The graphs below show the percentage of people holding full driving licences in Great Britain by age and sex.
Summarise the information by selecting and reporting the main features, and make comparisons where relevant.
Full car driving licence holders: by sex and age
Student answer (Band 5.5)
The bar graph compares holders of driving licence by gender and their age, they are distributed in ages and distinguished in two diffrent years 1975/76 to 2006. Where men graph rose from teenage to old between there 60s and decresed by age of 70 and over same for women. However we might get diffrence of driving licence holders in both the gender are more in 2006 than in 1975/76.
In 1975/76 we have less percentage of holders in both the genders than in 2006, however in age 21 to 29 in men we can see the rise of percentage of holders as compare to 2006, and we get the lowest number of holders in women section over the age of 70 and more in 1975/76 this is the lowest holders group all over the comparision of the graph.
Distinguishing the graph by sex we see there are more holders in men in both the years as in 1975/76 men average would be between 50 to 60 all over the age group, whereas in women average is 15 to 20. In 2006 the highest percentage of men holders are 90 to 95 whereas in women its just 80.
AI examiner evaluation
| Criterion | Band |
|---|---|
| Task Achievement / Task Response | 5.5 |
| Coherence and Cohesion | 5.5 |
| Lexical Resource | 5.0 |
| Grammatical Range and Accuracy | 5.0 |
| Overall | 5.5 |
Task Achievement / Task Response: Band 5.5
You identify the chart’s broad comparison between men and women and note that licence holding generally increased by 2006, especially among women and older age groups. You also correctly point out that women aged 70 and over had the lowest figure in 1975/76. However, the overview is unclear and some claims are too general or inaccurate: men’s figures did not simply rise from the teenage group to the 60s, and the 21–29 male figure was lower in 2006 (about 70%) than in 1975/76 (about 78%). The statement that both sexes had higher figures in 2006 also overlooks this exception and the small change among young men. Select the main patterns more precisely and support them with a few accurate comparisons.
Coherence and Cohesion: Band 5.5
The response has a basic paragraph structure: an opening description, a paragraph about the years and age groups, and a final comparison by sex. This gives the reader some organisation, and linking words such as “However” and “whereas” show attempts to connect ideas. Nevertheless, the progression is not consistently clear. The first paragraph combines the chart description, a trend, and an overview in a long sentence, while the second repeats the general point that 2006 figures were higher. Some references, such as “there 60s” and “this is the lowest holders group,” are difficult to interpret. Organise the report around a clear overview followed by focused comparisons, and use explicit references to age groups and years to make the relationships easier to follow.
Lexical Resource: Band 5.0
You use relevant chart vocabulary, including “percentage,” “holders,” “gender,” “age group,” and “highest,” so the topic is generally understandable. However, the range is limited and several word choices or collocations are inaccurate, which sometimes makes the meaning unclear. For example, “holders of driving licence” and “lowest holders group” are not natural ways to describe the data, while “rose from teenage to old” does not clearly express a trend. Spelling errors such as “diffrent,” “decresed,” and “comparision” are also noticeable. Aim for precise reporting language and check spelling; terms such as “proportion,” “licence holders,” “increased,” and “declined” would help you describe the figures more naturally.
Grammatical Range and Accuracy: Band 5.0
You attempt both simple and more complex sentences, using structures such as “whereas” and “as compare to,” but complex sentences are often faulty and errors occur frequently. For instance, “The bar graph compares holders of driving licence by gender and their age” has an unclear grammatical relationship, and “Where men graph rose…” is an incomplete or poorly formed clause. There are also problems with agreement and sentence boundaries in “the difference … are more,” as well as missing or incorrect articles and prepositions. These errors sometimes make the intended comparison difficult to understand. Build accuracy first with clear subject–verb patterns, then combine ideas using correctly formed clauses, for example: “The chart compares the percentages of men and women holding full licences in seven age groups.”
See this exact question answered at other band scores. The same prompt compared across bands.
Browse more IELTS Writing model answers or get your own writing scored by the same AI examiner.