Band 5.0 IELTS Writing Task 1 Model Answer
Overall Band Score: 5.0 · IELTS Summit Mastery · 2026-11-12
IELTS Writing Task 1 question
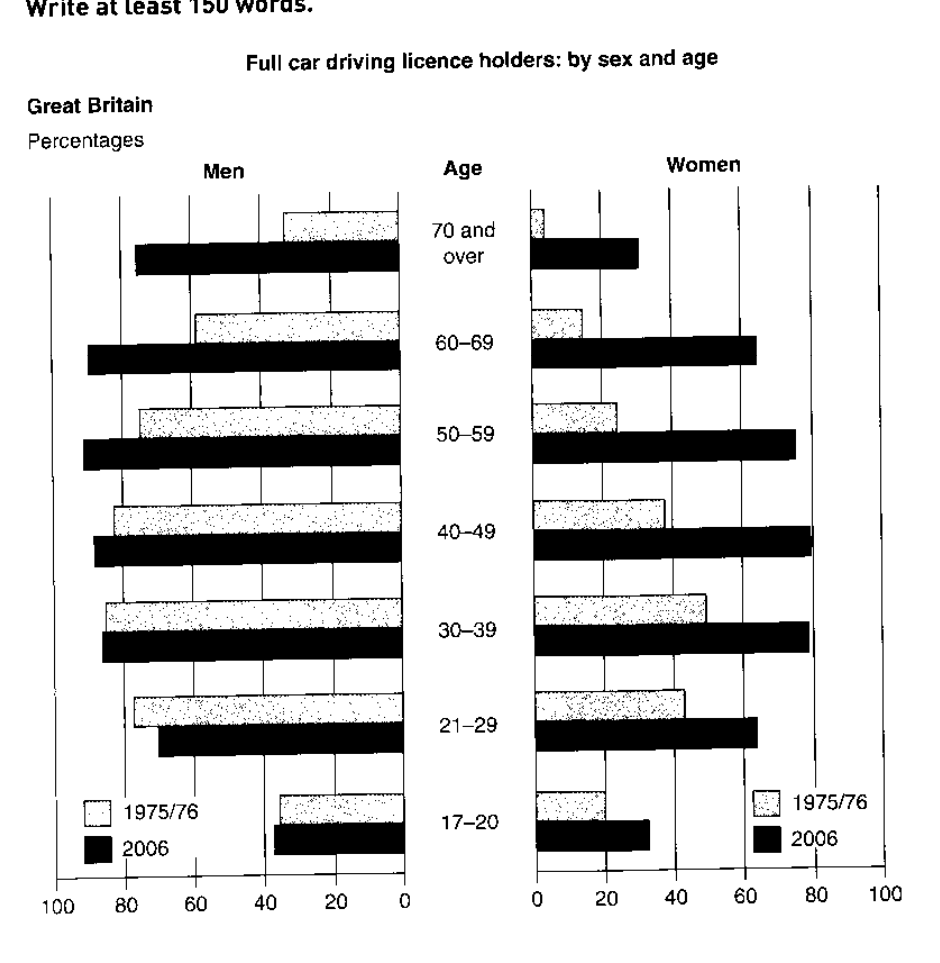
The graphs below show the percentage of people holding full driving licences in Great Britain by age and sex.
Summarise the information by selecting and reporting the main features, and make comparisons where relevant.
Full car driving licence holders: by sex and age
Student answer (Band 5.0)
The both bar graph illustrates the percentage of people. In Great Britain, that have full driving licences according to their age and sex.
Overall, one graph shows the data of men having lisence, while, second demostrate the women's information of lisence depending on their age. Men ratio are higher than women.
First, at the age of 17-20 men and women both have low percentage in 1975, only 20%, female can drive. In 2006, female drivers gradually increases upto 43-44%, in the age of 21-29. In contrast, male have higer rate than female.In 1975, above 35%, and rapidly increase at the age of 21-29, Close to 80%. In 2006, 21-29 age boys driving percentage is nearly 70%.
Similarly, as male and female are at their peak age level (30-49) most people hold driving licences. Men have higgest percentage of lisence holder, 95% in their adulthood 40-59s age, then this trend slowly decreases in 1975 .In 2006, men over 70 still drive about 75-80 can drive.
In comparison, female figure shows middle age women vast amount increase at 30- 49 remain stable and gradual decrease from 50-70 year.
Modern female HAVE
AI examiner evaluation
| Criterion | Band |
|---|---|
| Task Achievement / Task Response | 5.5 |
| Coherence and Cohesion | 5.0 |
| Lexical Resource | 5.0 |
| Grammatical Range and Accuracy | 5.0 |
| Overall | 5.0 |
Task Achievement / Task Response: Band 5.5
You identify the broad comparison that men had higher licence-holding rates than women, and you refer to changes across age groups and between the two years. However, the overview is limited and some key comparisons are inaccurate or unclear. For example, women aged 21–29 reached about 63% in 2006, not “43–44%”; that figure is closer to the 1975/76 level. The claim that men reached 95% at ages 40–59 is also too high: the chart shows roughly 89–92% in 2006. You mention increases among older women but do not clearly summarise the substantial rise across most age groups. A more accurate overview and carefully selected figures would make the report more complete and better supported.
Coherence and Cohesion: Band 5.0
The response has an opening, an overview and several body paragraphs, and words such as “Overall,” “First” and “In comparison” show an attempt to guide the reader. However, the progression is difficult to follow because comparisons shift between years, sexes and age groups without a consistent pattern. The first body paragraph, for instance, moves from young women to men and then back to a different year, while the next paragraph combines several age ranges and trends. Some linking phrases do not clearly express the relationship between ideas, and the final line, “Modern female HAVE,” is unfinished and disrupts the ending. Organise the details by age group or by year, and use clear topic sentences to establish each paragraph’s focus.
Lexical Resource: Band 5.0
You use some relevant vocabulary, including “percentage,” “gradually increases,” “peak” and “decreases,” so the topic is generally recognisable. However, the range is limited and several word choices or collocations are inaccurate, which sometimes makes the meaning difficult to interpret. Examples include “men ratio,” “boys driving percentage,” “peak age level” and “vast amount increase.” There are also repeated spelling errors in “lisence,” “demostrate” and “higgest,” alongside inconsistent use of “licence” and “drive.” Choose precise terms for the data, such as “proportion of licence holders,” “rose” and “remained relatively stable,” and check spelling and word forms carefully. Avoid informal or imprecise labels such as “boys” when referring to adult age groups.
Grammatical Range and Accuracy: Band 5.0
You attempt both simple and more complex sentences, including a contrast introduced by “In contrast” and a clause beginning “as male and female are at their peak age level.” However, sentence structures are often faulty, and frequent errors in agreement, articles, tense and punctuation make some statements hard to understand. For example, “The both bar graph illustrates” has an incorrect article and number pattern, while “female drivers gradually increases” has subject–verb disagreement. The opening sentence is also incorrectly divided after “people,” leaving “In Great Britain” as a fragment. Work on complete sentence construction, consistent past-tense reporting for the chart, and agreement between subjects and verbs. Proofread punctuation and avoid joining unrelated clauses with commas.
See this exact question answered at other band scores. The same prompt compared across bands.
Browse more IELTS Writing model answers or get your own writing scored by the same AI examiner.