Band 5.5 IELTS Writing Task 1 Model Answer
Overall Band Score: 5.5 · IELTS Summit Mastery · 2026-11-14
IELTS Writing Task 1 question
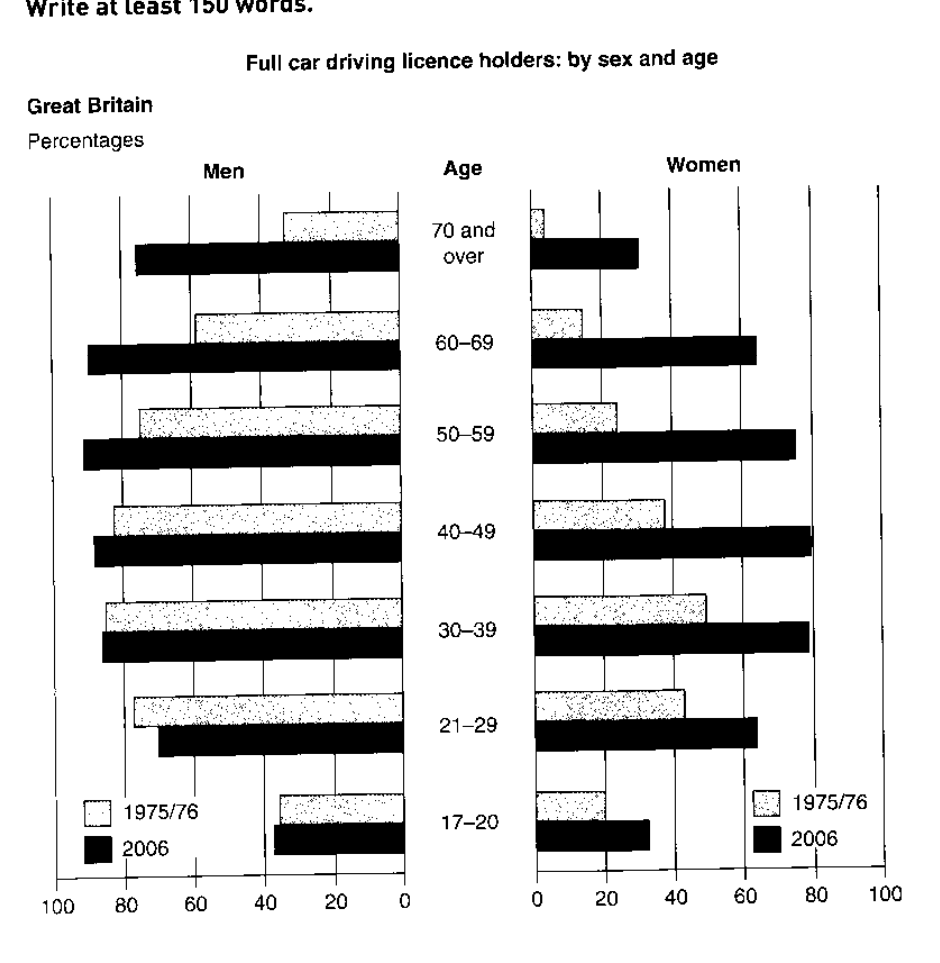
The graphs below show the percentage of people holding full driving licences in Great Britain by age and sex.
Summarise the information by selecting and reporting the main features, and make comparisons where relevant.
Full car driving licence holders: by sex and age
Student answer (Band 5.5)
The bar graphs compare the percentage of people owning full driving licenses in Grate Britain by age and sex between 1975 and 2006.
Overall, the percentage of women's ownership of driving licence increased over the period in all age categories while men stood at a relatively similar percentage in most age categories compared to women.
In 1975, men stood at almost 35% in 17-20 age category which sharply increased to about 77% in 21-29 age group.The proportion reached its peak at above 80% in 30-39 age group before declining gradually at 75% and 60% respectively in 50 to 69 age groups. Then it dramatically plummeted at below 40% in 20 and above afe category. In 2006, the ratio experienced a surge in all age groups.The percentage stood at below 40% initially in 17-20 age group and increade at above 80% in 30-39 age cat
AI examiner evaluation
| Criterion | Band |
|---|---|
| Task Achievement / Task Response | 4.5 |
| Coherence and Cohesion | 5.5 |
| Lexical Resource | 5.5 |
| Grammatical Range and Accuracy | 5.5 |
| Overall | 5.5 |
Task Achievement / Task Response: Band 4.5
You identify the chart’s subject and give a relevant overview, noting that women’s licence-holding rose across age groups and that men’s figures changed less. You also include some useful figures for men in 1975. However, the report is incomplete: it stops mid-sentence, so the 2006 comparison is not developed, and women’s figures are not described beyond the overview. Some details are inaccurate or unclear: men aged 30–39 were not at the peak in 1975 (the 40–49 group was highest), and the fall to about 60% applies to ages 60–69, not “50 to 69.” The response is also six words below the required minimum. To improve, complete the comparison and select accurate key figures for both sexes and years.
Coherence and Cohesion: Band 5.5
The response has a recognisable structure: an introduction, an overview, and a paragraph describing the figures. Sequencing words such as “Overall,” “In 1975,” “Then,” and “In 2006” help signal the movement between points. However, progression is limited because the account ends abruptly during the 2006 description, and there is no clear comparison of the two sexes or a concluding summary of the main patterns. Some links between figures are difficult to follow, particularly the shift from the 30–39 group to “50 to 69 age groups,” which leaves the 40–49 category unclear. Organise the body into a complete comparison of the two years or sexes, and use clear age-group references so each figure’s relationship to the next is easy to track.
Lexical Resource: Band 5.5
You use a relevant range of chart vocabulary, including “percentage,” “proportion,” “peak,” “declining,” and “plummeted,” which helps describe trends. There are also attempts to vary wording, such as “ownership” and “ratio.” However, some choices are inaccurate or unnatural for this context: people hold licences rather than “own” them, and “ratio” is not the right term for a percentage. “Grate Britain” and “afe” are spelling errors, while “increade” is also misspelled; these reduce precision. Some trend language is stronger than the data supports, such as “dramatically plummeted” for the decline among older men. Prefer precise terms such as “licence holders,” “proportion,” “rose,” and “fell,” and check spelling carefully.
Grammatical Range and Accuracy: Band 5.5
You attempt both simple and more complex sentence forms, including the overview clause “while men stood at a relatively similar percentage” and the sequence describing changes across age groups. Meaning is generally recoverable, but grammatical control is uneven. For example, “the percentage of women’s ownership … increased” has an awkward possessive construction, and “men stood at almost 35% in 17-20 age category” is missing an article before the age category. The sentence beginning “In 1975” also runs several comparisons together, making its structure difficult to follow. The final sentence is incomplete, ending at “age cat,” which prevents the reader from seeing a finished grammatical unit. Use complete sentences, add articles where needed, and separate long sequences of comparisons with clear punctuation.
See this exact question answered at other band scores. The same prompt compared across bands.
Browse more IELTS Writing model answers or get your own writing scored by the same AI examiner.