Band 5.0 IELTS Writing Task 1 Model Answer
Overall Band Score: 5.0 · IELTS Summit Mastery · 2026-11-05
IELTS Writing Task 1 question
The graph below shows the perceived danger and actual likelihood of being a victim of crime.
Summarise the information by selecting and reporting the main features, and make comparisons where relevant.
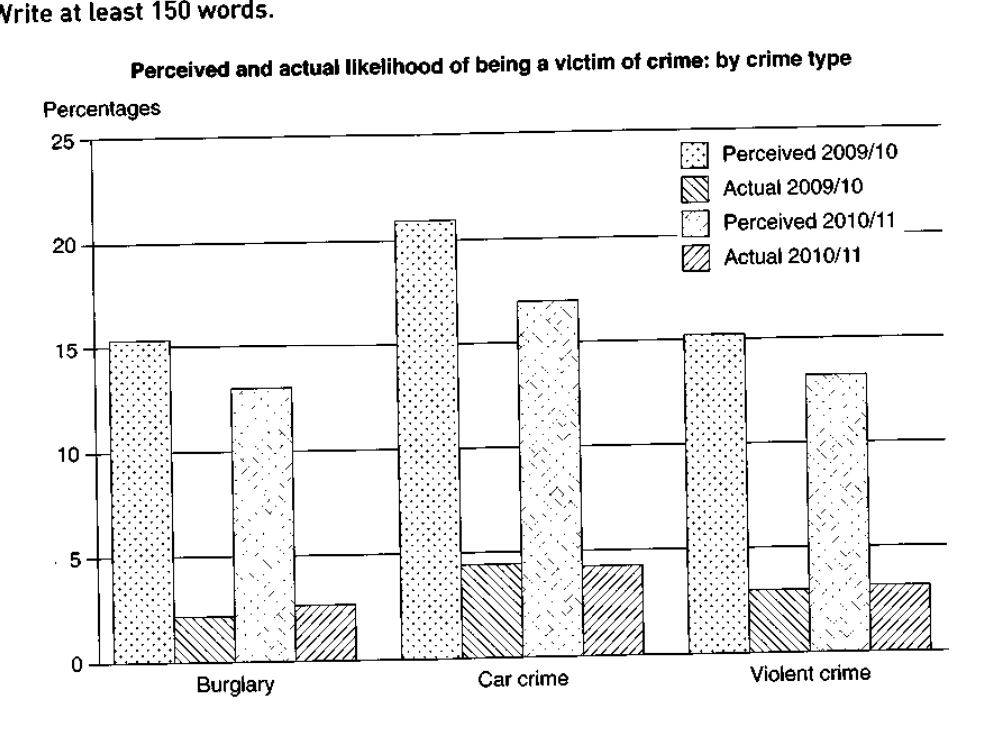
Perceived and actual likelihood of being a victim of crime: by crime type
Student answer (Band 5.0)
The bar graph highlights three different situation of crime and types of serious offenses in two decade 2009/10 and 2010/2011
overall most crime are happen with car like carjacking,opportunistic most illegal act which are passed in 2009/10 above 20% in next decade below 20% crime take place which are perceived but actual percentage of serious offanse is not so high in four year only 4%
The next categories of voilence is violent crime and burglary above the 15% serious offense in two types which are not happen actually in 2009/10 and in next two years the crime percentage dropped to below 15% in burglary and violent crime
the ratio of serious offense actually happen more in violent crime almost 3% in two decades and in a burglary near 3% in 2010/11 2% in 2009/10
AI examiner evaluation
| Criterion | Band |
|---|---|
| Task Achievement / Task Response | 5.0 |
| Coherence and Cohesion | 5.0 |
| Lexical Resource | 5.0 |
| Grammatical Range and Accuracy | 4.5 |
| Overall | 5.0 |
Task Achievement / Task Response: Band 5.0
You identify the three crime categories and make relevant comparisons between perceived and actual risk, including the broad point that perceived figures are much higher. You also note that car crime has the highest perceived rate and that perceptions fall in 2010/11. However, the account is only partial: the overview is unclear, and some details are inaccurate or imprecise. For example, car crime is about 21% in 2009/10 and 17% in 2010/11, not simply “above 20%” and “below 20%”; actual car crime is about 4.5% in both periods, rather than “only 4%.” The response also falls 16 words short of the required minimum. A clearer overview and more accurate comparisons across both years would make the summary more complete.
Coherence and Cohesion: Band 5.0
There is some organisation: the response begins with a general statement, then discusses car crime, followed by violent crime and burglary. This gives the reader a basic route through the chart. However, progression is not consistently clear, and the paragraphs are not separated, so the overview and supporting details run together. Linking phrases such as “The next categories” do not clearly show how the information is being compared, while “in two decades” is confusing because the chart covers two one-year periods. Several ideas are also compressed into long, loosely connected sentences. Use distinct paragraphs for the overview and key comparisons, and connect figures explicitly by category and year to improve the flow.
Lexical Resource: Band 5.0
You use some relevant topic vocabulary, including “perceived,” “actual percentage,” “violent crime,” and “burglary,” which helps communicate the chart’s subject. However, the range is limited and several word choices or collocations make the meaning difficult to follow. For instance, “three different situation of crime” and “serious offense” do not describe the chart’s categories or measures precisely; “crime take place which are perceived” is also unclear. Spelling errors such as “voilence” and “offanse,” along with informal or unsupported examples like “carjacking,” reduce precision. Aim to use standard chart language consistently, such as “crime categories,” “perceived likelihood,” and “actual incidence,” and avoid adding examples not shown in the data.
Grammatical Range and Accuracy: Band 4.5
The response attempts to combine ideas in longer sentences, but grammatical control is inconsistent and the range of sentence structures remains limited. Errors in agreement and verb forms appear in phrases such as “most crime are happen” and “which are passed,” while “the crime percentage dropped” does not clearly identify what changed. Articles, plurals, and sentence boundaries are also frequently problematic; for example, the opening sentence lacks a clear grammatical structure, and the response has little effective punctuation. These errors sometimes make relationships between the figures hard to understand. Practise writing short, complete comparison sentences first, then combine them with accurate clauses—for example, “Perceived risk of car crime fell from about 21% to 17%, while the actual rate remained around 4.5%.”
See this exact question answered at other band scores. The same prompt compared across bands.
Browse more IELTS Writing model answers or get your own writing scored by the same AI examiner.