Band 5.5 IELTS Writing Task 1 Model Answer
Overall Band Score: 5.5 · IELTS Summit Mastery · 2026-11-06
IELTS Writing Task 1 question
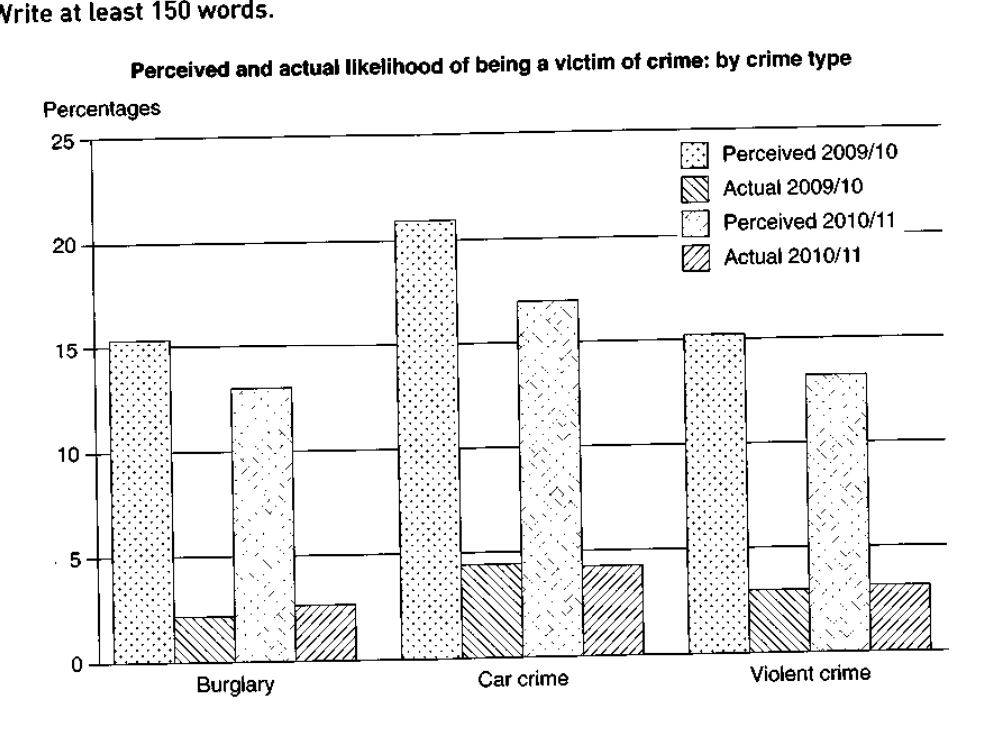
The graph below shows the perceived danger and actual likelihood of being a victim of crime.
Summarise the information by selecting and reporting the main features, and make comparisons where relevant.
Perceived and actual likelihood of being a victim of crime: by crime type
Student answer (Band 5.5)
The bar graph illustrate the perceived danger and actual liklihood of being a victim of crime.
Overall, the highest percentage of perceived 2009/10 was recorded in car crime, while the lowest percentage of actual 2009/10 of being victim of crime was recorded in burglary.In contrast the percentage of car crime in actual 2009/10 and actual 2010/11 had the same percentage.
By considering the line graph, the surged percentage was recorded in car crime at roughly about 22% by perceived 2009/10 being a victim of crime, In contrast the plumet percentage was accounted in burglary by actual liklihood of being a victum of crime at roughly less then 5%.Firthermore the perceived 2009/10 and perceived 2010/11 were allocated at same under the 15% in burglary and in violent crime. In addition, the percentage of car crime and violent crime in actual 2009/10 or in actual 2010/11 were almost standed under the 5%.
AI examiner evaluation
| Criterion | Band |
|---|---|
| Task Achievement / Task Response | 5.5 |
| Coherence and Cohesion | 5.5 |
| Lexical Resource | 5.5 |
| Grammatical Range and Accuracy | 5.0 |
| Overall | 5.5 |
Task Achievement / Task Response: Band 5.5
You identify several relevant features, including car crime as the highest perceived category in 2009/10 and burglary as the lowest actual category in that year. You also note that actual car-crime figures were unchanged across the two years. However, the overview is incomplete and some comparisons are unclear or inaccurate: perceived burglary and violent crime were not both “under 15%” in 2009/10, as each was about 15.5%, and the response does not clearly report the general fall in perceived figures from 2009/10 to 2010/11. The actual figures, by contrast, rose slightly for burglary and violent crime while car crime stayed level. Select these main trends and give clearer, accurate comparisons to make the summary more complete.
Coherence and Cohesion: Band 5.5
There is an attempt to organise the response with an opening, an overview beginning “Overall,” and further details introduced by “Furthermore” and “In addition.” This gives the reader some sense of structure. However, the progression is not consistently clear: the overview combines several comparisons in one long sentence, and the next paragraph begins “By considering the line graph,” although the visual is a bar graph. Connections such as “In contrast” do not always show a clear contrast, and the final details are grouped without a clear order by year or crime type. Use a distinct overview followed by a paragraph comparing perceived figures and another comparing actual figures, with linking phrases that accurately express the relationship between the data.
Lexical Resource: Band 5.5
The response uses some task-relevant vocabulary, including “percentage,” “perceived,” “actual,” and “recorded,” and attempts more descriptive terms such as “surged” and “plumet.” However, several choices are inaccurate or unnatural for describing a chart: “surged” suggests a rise over time, while the sentence describes a high value, and “allocated” and “standed” do not fit the context. Spelling errors such as “liklihood,” “victum,” and “Firthermore” also reduce accuracy. Aim for precise, conventional reporting language and accurate spelling; verbs such as “stood at,” “was highest,” “declined,” and “remained unchanged” would describe the figures more naturally.
Grammatical Range and Accuracy: Band 5.0
You attempt both simple statements and longer sentences with contrast markers, but control is uneven and errors sometimes make relationships difficult to follow. For example, “The bar graph illustrate” has subject–verb disagreement, while “the highest percentage of perceived 2009/10” is an incomplete or unclear grammatical construction. The sentence beginning “By considering…” runs several ideas together, with inconsistent capitalisation and punctuation, and “being victim of crime” is missing an article. Practise building clear comparison sentences with a subject and verb for each figure, such as “The perceived figure for car crime was highest in 2009/10.” Check agreement, articles, sentence boundaries, and punctuation when editing.
See this exact question answered at other band scores. The same prompt compared across bands.
Browse more IELTS Writing model answers or get your own writing scored by the same AI examiner.