Band 4.5 IELTS Writing Task 1 Model Answer
Overall Band Score: 4.5 · IELTS Summit Mastery · 2026-11-07
IELTS Writing Task 1 question
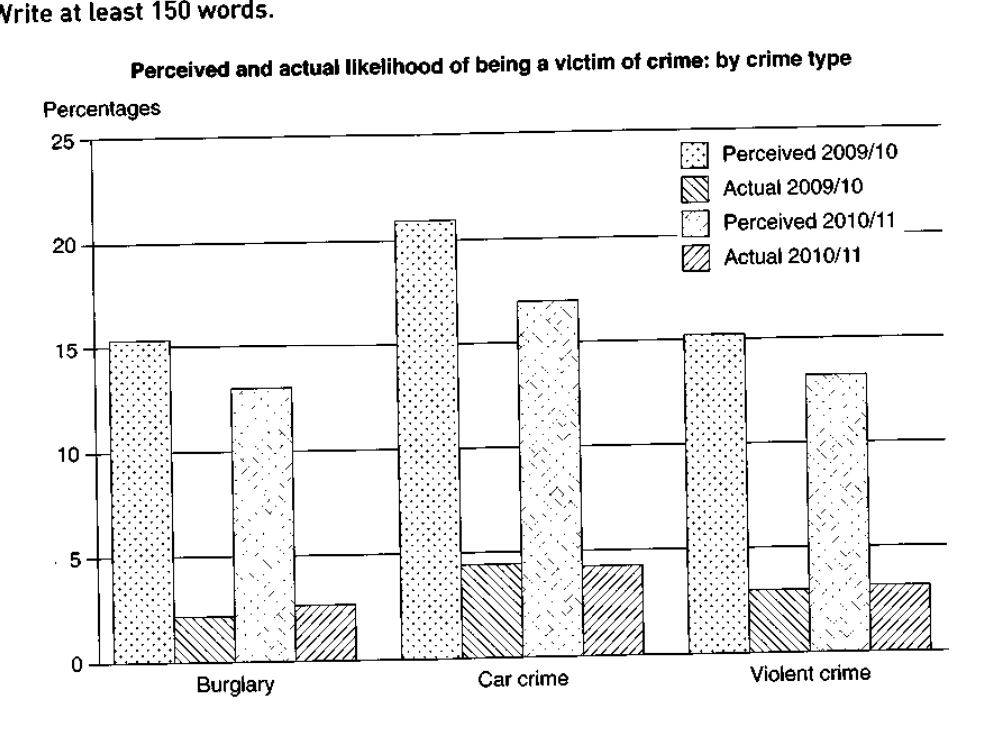
The graph below shows the perceived danger and actual likelihood of being a victim of crime.
Summarise the information by selecting and reporting the main features, and make comparisons where relevant.
Perceived and actual likelihood of being a victim of crime: by crime type
Student answer (Band 4.5)
The bar graph illustrate the perceived and actual likelihood of being a victom of crimes in different catageries presents in percentage.
overall, respectially the type of car crime averages were highest stage however, the level of burglary almost lowest poient . furthermore, the stage of violent crime and burglary similarly remained .
In the begining , 2009/10,car crime perceived serial crime rate percentage increased the figer of level estimated 22% and in violent crime desreased on the other hand in burglary and violent ere stabled . the level of actual crime in 2009/10 ,in car crime rosed then the other two ,in 2010/ 11 , perceived crime rate in burgulary lowest poient whereas the violent and car crime gradually climbed ,in 2010/11, the actual crime in increased the the other two countrie
The burglary crime list in 2009 were incresed but with the passage of time the rate in 2010 were decreased . car crime of perceived in 2009 almost hight poient then the actual lower level .
AI examiner evaluation
| Criterion | Band |
|---|---|
| Task Achievement / Task Response | 4.5 |
| Coherence and Cohesion | 4.0 |
| Lexical Resource | 4.5 |
| Grammatical Range and Accuracy | 4.5 |
| Overall | 4.5 |
Task Achievement / Task Response: Band 4.5
You identify the chart’s subject and make an attempt at an overview, noting that car crime is highest and that burglary and violent crime are similar. However, the comparisons are often unclear or inaccurate: perceived car crime falls from about 21% in 2009/10 to 17% in 2010/11, rather than “gradually climbed,” while perceived burglary also falls, not rises. Actual rates are low across all categories and change only slightly, but this pattern is not clearly summarised. The response also gives few reliable figures and does not consistently distinguish perceived likelihood from actual victimisation. To strengthen the report, state the main overall contrasts accurately, then compare the two years using selected figures for each series.
Coherence and Cohesion: Band 4.0
There is a basic attempt to organise the response, beginning with an introduction and overview before moving to details. However, the progression is difficult to follow because the body shifts between crime types, years, and perceived versus actual rates without a clear organising principle. Phrases such as “in the begining” and “in 2010/11” recur, but the links do not make the comparisons easier to track. The final paragraph repeats the point about perceived car crime being high without adding a clear comparison. Use separate, purposeful paragraphs—for example, an overview followed by perceived figures and actual figures—and connect each comparison explicitly.
Lexical Resource: Band 4.5
The response uses some relevant chart vocabulary, including “perceived,” “actual,” “percentage,” and “crime rate,” so the topic is recognisable. However, the range is basic and repeated, and frequent spelling and word-choice problems make several statements hard to interpret: “victom,” “catageries,” “poient,” and “hight poient” are examples. Some combinations are also unnatural, such as “the level of actual crime … rosed” and “car crime averages were highest stage.” Choose precise reporting verbs and nouns, such as “stood at,” “fell,” “remained stable,” and “proportion,” and check spelling carefully. This would make the comparisons clearer and more appropriate for an academic chart summary.
Grammatical Range and Accuracy: Band 4.5
You attempt longer sentences and use time references, but grammatical control is weak and errors frequently obscure relationships between the data. For example, “The bar graph illustrate” has subject–verb disagreement, while “in 2009/10,car crime perceived serial crime rate percentage increased” lacks a clear sentence structure. Verb forms are also unreliable in “the actual crime … rosed,” and clauses are joined without effective punctuation, as in “in burglary and violent ere stabled.” Most sentences need clearer subjects and verbs. Practise writing one comparison per sentence, using accurate past-tense forms and punctuation, before attempting longer linked structures.
See this exact question answered at other band scores. The same prompt compared across bands.
Browse more IELTS Writing model answers or get your own writing scored by the same AI examiner.