Band 4.0 IELTS Writing Task 1 Model Answer
Overall Band Score: 4.0 · IELTS Summit Mastery · 2026-11-07
IELTS Writing Task 1 question
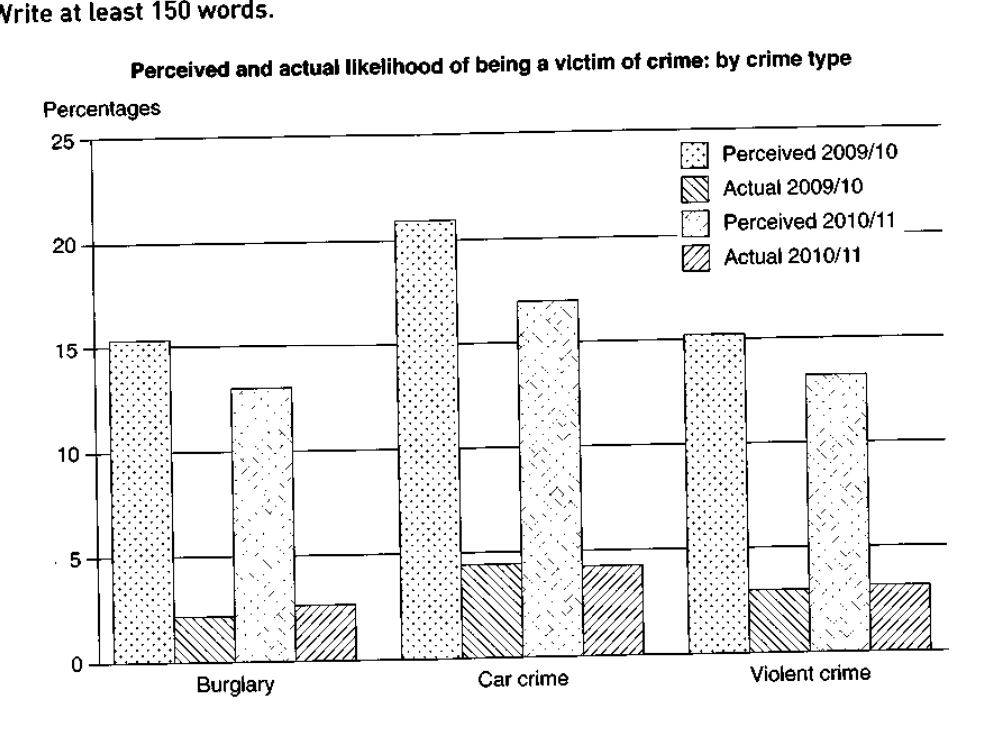
The graph below shows the perceived danger and actual likelihood of being a victim of crime.
Summarise the information by selecting and reporting the main features, and make comparisons where relevant.
Perceived and actual likelihood of being a victim of crime: by crime type
Student answer (Band 4.0)
in our most of the people are suffering from
crime in 2009 the burgalry crime range is at15 percent people they thought would be a crime and in 2010 the burgalry is at13percent they thought would be victim like it was at2 percent the car crime was highest in the 2010 at18percent and in 2009 at 21percent people would be a victim but actual rate is five percent for voilent crime in 2009 and [redacted phone] the precive rate of voilent crime people is Fifteen to tweenty but actual rate is two percent
AI examiner evaluation
| Criterion | Band |
|---|---|
| Task Achievement / Task Response | 3.5 |
| Coherence and Cohesion | 3.0 |
| Lexical Resource | 4.5 |
| Grammatical Range and Accuracy | 4.5 |
| Overall | 4.0 |
Task Achievement / Task Response: Band 3.5
You identify the three crime types and make some relevant comparisons, including that perceived burglary risk fell from about 15% to 13% and that car crime had the highest perceived figures. However, the account is incomplete and several details are inaccurate or unclear: the actual car-crime rate was about 4.5% in both years, not 5% specifically for violent crime, and actual violent-crime risk was about 3% and 3.5%, not 2%. There is no clear overview of the main pattern, such as perceived risk being much higher than actual risk for every crime type. The response also falls 57 words short of the required minimum, limiting the detail and coverage possible. Include a concise overview and report the key comparisons accurately.
Coherence and Cohesion: Band 3.0
The response contains a few identifiable points in a roughly chart-based order, moving from burglary to car crime and then violent crime. This gives the reader some sense of the categories being discussed. However, the information is compressed into one long, loosely connected sequence, with no paragraphing or clear overview. Links such as “and” do not show whether figures refer to perceived or actual risk, and the shift in “in 2010 and 2010 2011” makes the time comparison difficult to follow. Organise the response into an introduction, an overview, and a short detail paragraph, and use explicit contrasts such as “whereas” and “by comparison” to clarify relationships.
Lexical Resource: Band 4.5
You use some relevant chart vocabulary, including “range,” “actual rate,” “perceived rate,” and “highest,” so the reader can recognise the general subject. However, the range is narrow and several word choices or spellings reduce precision: “burgalry” and “voilent” are misspelled, while “people they thought would be a crime” does not clearly express perceived likelihood. “Suffering from crime” is also an unnatural way to describe the chart’s subject. Use accurate terms consistently, such as “perceived risk,” “actual likelihood,” and “victim of burglary.” Check spelling and choose phrases that describe percentages rather than people’s thoughts.
Grammatical Range and Accuracy: Band 4.5
There are attempts to compare years and figures, and some basic sentence patterns are understandable. However, most of the response is joined into one run-on sentence, with limited control of clause boundaries and punctuation. For example, “in 2009 the burgalry crime range is at15 percent people they thought would be a crime” combines several ideas without a clear grammatical relationship. Tense and sentence structure are also inconsistent, as in “the car crime was highest in the 2010 at18percent.” Use separate sentences for each comparison, add full stops and commas, and practise clear patterns such as “The perceived figure for burglary fell from about 15.5% in 2009/10 to 13% in 2010/11.”
See this exact question answered at other band scores. The same prompt compared across bands.
Browse more IELTS Writing model answers or get your own writing scored by the same AI examiner.