Band 5.0 IELTS Writing Task 1 Model Answer
Overall Band Score: 5.0 · IELTS Summit Mastery · 2026-11-08
IELTS Writing Task 1 question
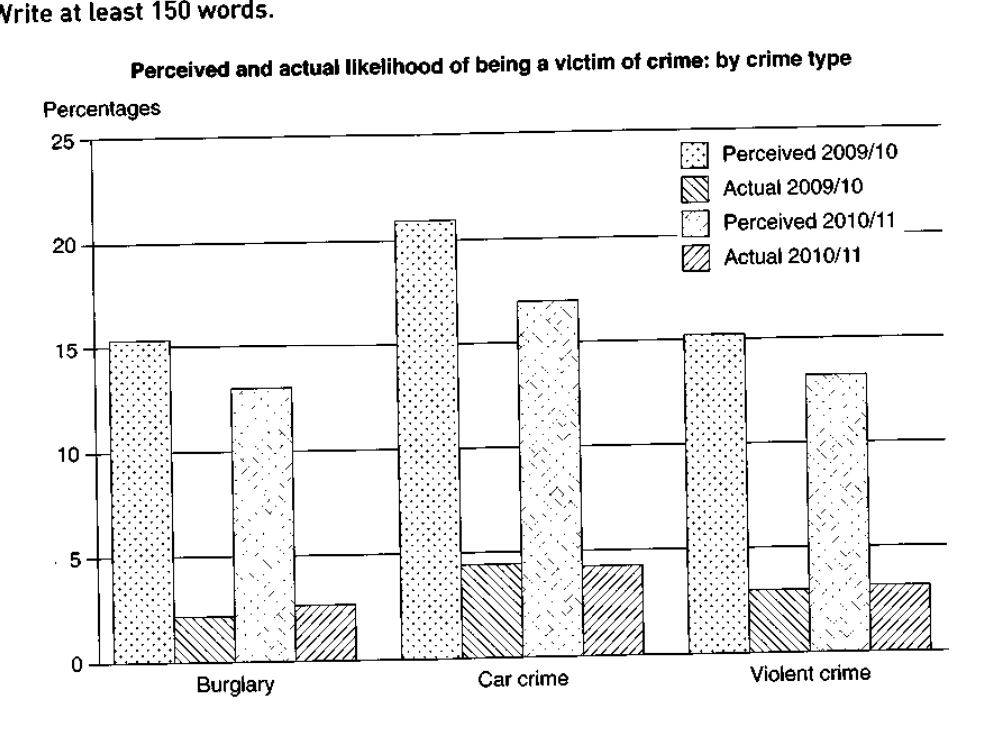
The graph below shows the perceived danger and actual likelihood of being a victim of crime.
Summarise the information by selecting and reporting the main features, and make comparisons where relevant.
Perceived and actual likelihood of being a victim of crime: by crime type
Student answer (Band 5.0)
The given graph illustrates the percentage of actual perceived and likelihood of crime by dependening on there different crimes.
overall, it is clear that the highest percentage of perceived was the perceived of 2009/10 and the lowest is actual 2009/10 and 2010/11 . while the perceived 2010/11 experience some fluctuations.
To begin with, perceived 2009/10 the data show that it star with 15 % at beginning but after that the proportion rose by 21 % which is the highest however it decreased at 15% by following period.
Coming to the, actual 2009/10 and 2010 /11 the proportion was the lowest in the graph and remain 2% to 4 % respectively.On the other hand, the perceived of 2010/12 experience fluctuation it increased from 13% to 17% and decreased at 12 %.
AI examiner evaluation
| Criterion | Band |
|---|---|
| Task Achievement / Task Response | 4.5 |
| Coherence and Cohesion | 5.0 |
| Lexical Resource | 5.0 |
| Grammatical Range and Accuracy | 5.0 |
| Overall | 5.0 |
Task Achievement / Task Response: Band 4.5
You identify the chart’s broad contrast between perceived and actual crime likelihood, and you note that perceived figures are generally higher. However, the account is incomplete and includes important inaccuracies: the 21% figure belongs to perceived car crime in 2009/10, not a rise within one crime category, and perceived 2010/11 car crime is about 17%, not 12%. The actual figures are also not described accurately as a range of 2% to 4% “respectively”; they vary by crime and year, reaching about 4.5%. There is no clear, accurate overview of the main pattern across all three crime types. The response is also 20 words below the required minimum. Include a concise overview and compare the categories and years using correctly matched figures.
Coherence and Cohesion: Band 5.0
The response has a basic paragraph structure: an introduction, an overview, and two body paragraphs. Phrases such as “To begin with” and “On the other hand” show an attempt to guide the reader. However, the progression is not consistently clear because the data are grouped by year in some places and by perceived versus actual likelihood in others, without a clear comparison framework. The overview’s reference to “fluctuations” is not well connected to the chart, and “Coming to the, actual…” interrupts the flow. Some linking expressions are used mechanically or inaccurately. Organise the body paragraphs around perceived and actual figures, or compare each crime type across both years, and use transitions that clearly express the relationship between the figures.
Lexical Resource: Band 5.0
You use some relevant chart vocabulary, including “percentage,” “proportion,” “highest,” “lowest,” “increased,” and “decreased,” so the reader can recognise the intended topic. However, the range is limited and several word choices or collocations make the meaning unclear. For example, “actual perceived and likelihood” does not accurately describe the chart, “by dependening on there different crimes” is difficult to interpret, and “the perceived of 2009/10” is not a natural phrase. “Experience some fluctuations” is also imprecise for the simple changes shown. Use accurate terms such as “perceived likelihood,” “actual victimisation rate,” and “crime category,” and describe figures with clear verbs such as “stood at,” “fell to,” or “was higher than.” Check spelling and word forms before submitting.
Grammatical Range and Accuracy: Band 5.0
You attempt both simple and more extended sentence forms, including a contrast introduced by “while” and a sequence using “but after that.” However, control is inconsistent, and errors in sentence construction, verb forms, articles, and punctuation sometimes make relationships between ideas difficult to follow. For example, “the highest percentage of perceived was the perceived of 2009/10” lacks a clear grammatical structure, while “it star with 15%” has an incorrect verb form. The sentence beginning “Coming to the…” is also incomplete or awkwardly joined, and spacing after full stops is inconsistent. Practise writing complete sentences with a clear subject and verb, and use past-tense reporting consistently, for example: “Perceived car-crime risk stood at 21% in 2009/10.”
See this exact question answered at other band scores. The same prompt compared across bands.
Browse more IELTS Writing model answers or get your own writing scored by the same AI examiner.