Band 6.0 IELTS Writing Task 1 Model Answer
Overall Band Score: 6.0 · IELTS Summit Mastery · 2026-11-08
IELTS Writing Task 1 question
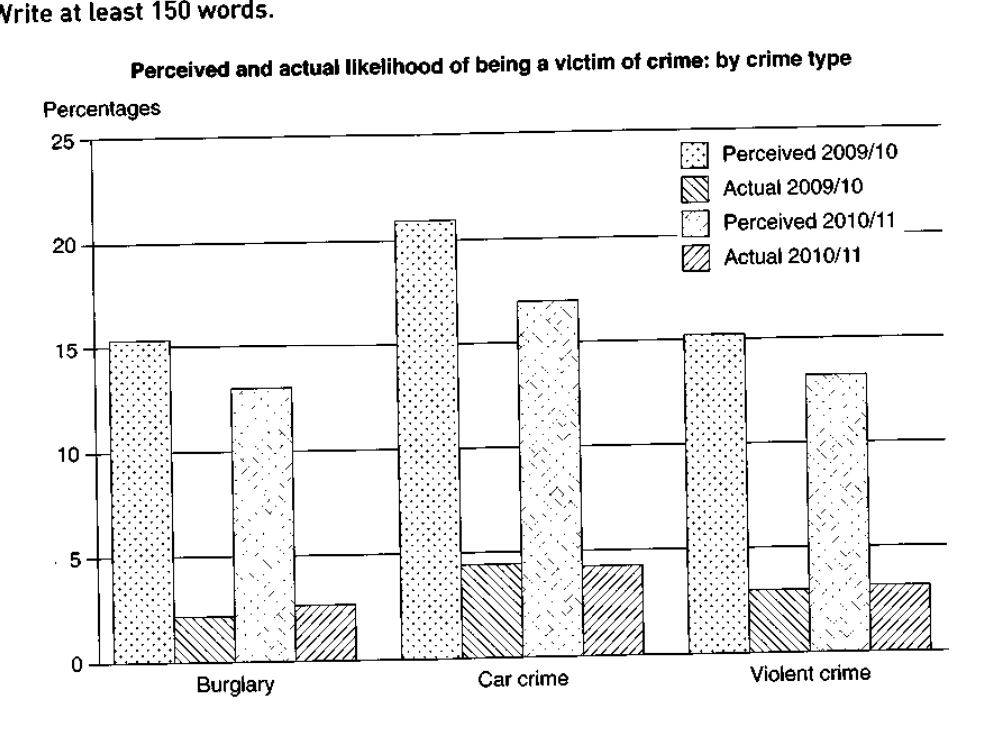
The graph below shows the perceived danger and actual likelihood of being a victim of crime.
Summarise the information by selecting and reporting the main features, and make comparisons where relevant.
Perceived and actual likelihood of being a victim of crime: by crime type
Student answer (Band 6.0)
The graph illustrates the percentages of actual crimes like burglary, car crime, and violent crime versus people's interpretation of falling victim to such crime over the period of one year from 2009 to 2010.
Overall,it is clear from the bar chart that, the number of pereived danger is greater than actual danger happened. People believe they are most likely to be affected by car crime, and the actual number varies a great deal.
In 2009, the interpretation of people for car crime was more than 20% but in actual it was only 4-5%. Similarly, there is a major difference in burglary and violent crime, perceived to be 15-16%, while the actual ratio was only 2-3%.
In 2010, although people associated the likelihood of crime 17% which is less than 22% but actual crime ratio was similar, that is, 4%. Moreover, people's perception fell by about 3-4% in 2010, but the ratio of real danger was less than perceived. The ratio of burglary and violence was about 2-3%, which was identified as 13-14%.
AI examiner evaluation
| Criterion | Band |
|---|---|
| Task Achievement / Task Response | 6.0 |
| Coherence and Cohesion | 6.0 |
| Lexical Resource | 5.5 |
| Grammatical Range and Accuracy | 5.5 |
| Overall | 6.0 |
Task Achievement / Task Response: Band 6.0
You identify the chart’s central contrast: perceived risk is much higher than actual victimisation for all three crime types, and car crime is highest in both measures. You also compare the two periods and include relevant figures, such as perceived car crime falling from just over 20% to about 17%. However, some details are unclear or inaccurate: “the actual number varies a great deal” is not supported, since actual rates change only slightly, and the statement that the actual car-crime figure was “4%” in 2010/11 should be closer to 4.5%. The overview also says actual danger “happened,” which blurs the distinction between perceived likelihood and recorded victimisation. A more precise overview and clearer reporting of the small changes would strengthen coverage.
Coherence and Cohesion: Band 6.0
The response has a recognisable structure: an introduction, an overview, and separate comparisons for the two periods. This gives the reader a generally coherent route through the information, and linking expressions such as “Overall,” “Similarly,” and “Moreover” help connect points. However, the progression is sometimes weakened by unclear references and awkwardly joined ideas. For example, “although people associated the likelihood of crime 17% which is less than 22% but actual crime ratio was similar” is difficult to follow, and “the ratio of burglary and violence” does not clearly identify whether the figures refer to perceived or actual rates. Use one paragraph to compare perceived and actual figures across categories, then another to describe changes between years, with explicit labels for each series.
Lexical Resource: Band 5.5
You use a reasonable range of task-related vocabulary, including “percentages,” “perceived,” “actual,” “likelihood,” and “associated,” and the reader can generally understand the comparisons. However, several choices are imprecise or unnatural for describing a chart. “Interpretation of people” is not a natural equivalent of perception, while “actual crimes” and “actual danger happened” confuse crime incidence with the likelihood of victimisation. “The actual number varies a great deal” also overstates the small changes shown. There are spelling errors in “pereived,” and repeated use of “ratio” is not the best fit for percentages. Aim for precise terms such as “perceived risk,” “recorded victimisation,” and “percentage” to make comparisons clearer and more idiomatic.
Grammatical Range and Accuracy: Band 5.5
You attempt a mix of simple and complex sentences, including a contrast with “although” and a comparison introduced by “while.” Most of the intended meaning remains understandable, but some sentence structures are not controlled consistently. For example, “although people associated the likelihood of crime 17% … but actual crime ratio was similar” combines two contrasting constructions, and “the number of pereived danger is greater than actual danger happened” has problems with sentence structure and tense. There are also punctuation and spacing issues, such as “Overall,it,” and unnecessary commas after “chart that.” Work on forming complete comparisons with parallel structures, and check articles, verb forms, and punctuation so that complex sentences remain clear.
See this exact question answered at other band scores. The same prompt compared across bands.
Browse more IELTS Writing model answers or get your own writing scored by the same AI examiner.