Band 5.5 IELTS Writing Task 1 Model Answer
Overall Band Score: 5.5 · IELTS Summit Mastery · 2026-11-08
IELTS Writing Task 1 question
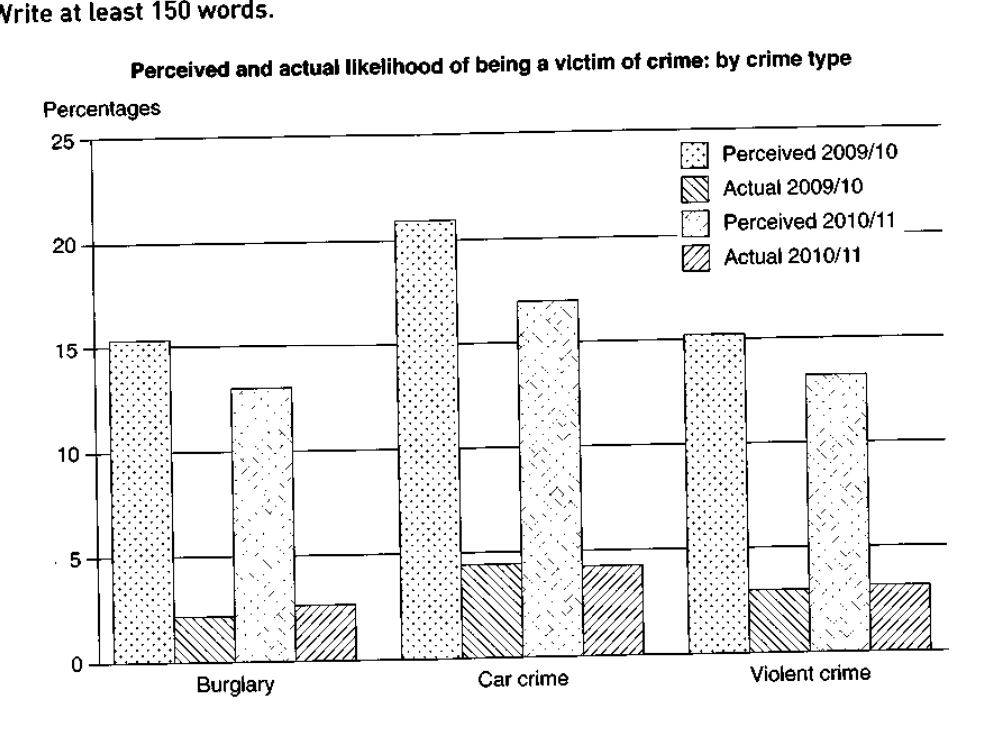
The graph below shows the perceived danger and actual likelihood of being a victim of crime.
Summarise the information by selecting and reporting the main features, and make comparisons where relevant.
Perceived and actual likelihood of being a victim of crime: by crime type
Student answer (Band 5.5)
The bar graph compares the percentage of perceived danger and actual likelihood of being a victim of crime from 2009 to 2011.
Overall, perceived danger is comparitively higher than actual danger in all these years. Actual Car crime was the highest during 2009/10 and burglary was the lowest in 2009/10.
In 2009/10, the perceived danger due to burglary crimes were around 15% but actual likelihood was just below 2.5%. However, the perceived danger due to Burglary was slightly lower during the year 2010/11 but the actual likelihood of being a victim increased to slightly above 2.5%. In 2009/10, the violent crimes were perceived to be just above 15% but the actual likelihood to be a victim was around 2.5%. On the other hand, in the 2010/11, the percieved danger due to violent crime was just above 12.5% which lesser than the year 2009/10. But the actual likelihood of being a victim was the same las in 2009/10 which is around 2.5%.
Car crimes were the highest in 2009/10 with perceived danger over 20% and actual possibility of being a victim was still the highest among all with just below 5%. In 2010/11 the perceived danger slightly got reduced from 2009/10 to just below 17.5% but the actual possibility of a victime was still the same which was just below 5%.
AI examiner evaluation
| Criterion | Band |
|---|---|
| Task Achievement / Task Response | 5.5 |
| Coherence and Cohesion | 5.5 |
| Lexical Resource | 5.5 |
| Grammatical Range and Accuracy | 5.5 |
| Overall | 5.5 |
Task Achievement / Task Response: Band 5.5
You identify the main contrast accurately: perceived risk is much higher than actual victimisation, and car crime is highest in both measures. You also compare both years for each crime type. However, the overview is incomplete and includes a misleading point: “Actual Car crime was the highest during 2009/10” overlooks that actual car crime is equally high in 2010/11. Several figures are imprecise or inaccurate: violent-crime actual likelihood is about 3% and 3.5%, not around 2.5% in both years; perceived violent crime in 2010/11 is about 13.5%. The response therefore selects relevant features but does not report them consistently or fully. A clearer overview and more accurate comparisons would strengthen it.
Coherence and Cohesion: Band 5.5
The response has a recognisable structure, with an introduction, an overview and paragraphs describing the crime categories. Comparisons are signalled with words such as “However” and “On the other hand,” and the reader can generally follow the movement from burglary to violent crime and then car crime. However, the overview does not establish a complete summary of the main trends, and the body’s progression is somewhat repetitive: each category is described in a similar sequence without grouping the most important comparisons. Some linking is awkward or unclear, as in “But the actual likelihood … was the same las in 2009/10.” Organising the details more systematically and using clearer references would improve the flow.
Lexical Resource: Band 5.5
You use relevant vocabulary for describing a chart, including “percentage,” “perceived danger,” “actual likelihood,” “slightly lower” and “reduced.” This gives the response enough range to communicate the main comparisons. However, some wording is repetitive or imprecise: “danger” is used repeatedly where “perceived likelihood” or “perceived risk” would be more exact, and “actual possibility” is less suitable than “actual rate.” There are also noticeable spelling errors, including “comparitively,” “percieved” and “victime,” as well as inconsistent capitalisation of “Burglary.” These do not prevent understanding, but careful proofreading and more precise chart vocabulary would make the report clearer and more natural.
Grammatical Range and Accuracy: Band 5.5
You attempt a mixture of simple and more complex sentences, including comparisons introduced by “but,” “however” and “on the other hand.” Most of the intended meaning remains understandable. However, errors recur in sentence construction and agreement. For example, “the perceived danger due to burglary crimes were” has a singular subject with a plural verb, while “which lesser than the year 2009/10” is missing a verb. The phrase “in the 2010/11” also uses an unnecessary article, and “the same las in 2009/10” contains a faulty construction. Aim for complete, controlled comparison clauses, such as “This figure was lower than in 2009/10,” and check agreement and articles when editing.
See this exact question answered at other band scores. The same prompt compared across bands.
Browse more IELTS Writing model answers or get your own writing scored by the same AI examiner.