Band 6.0 IELTS Writing Task 1 Model Answer
Overall Band Score: 6.0 · IELTS Summit Mastery · 2026-11-08
IELTS Writing Task 1 question
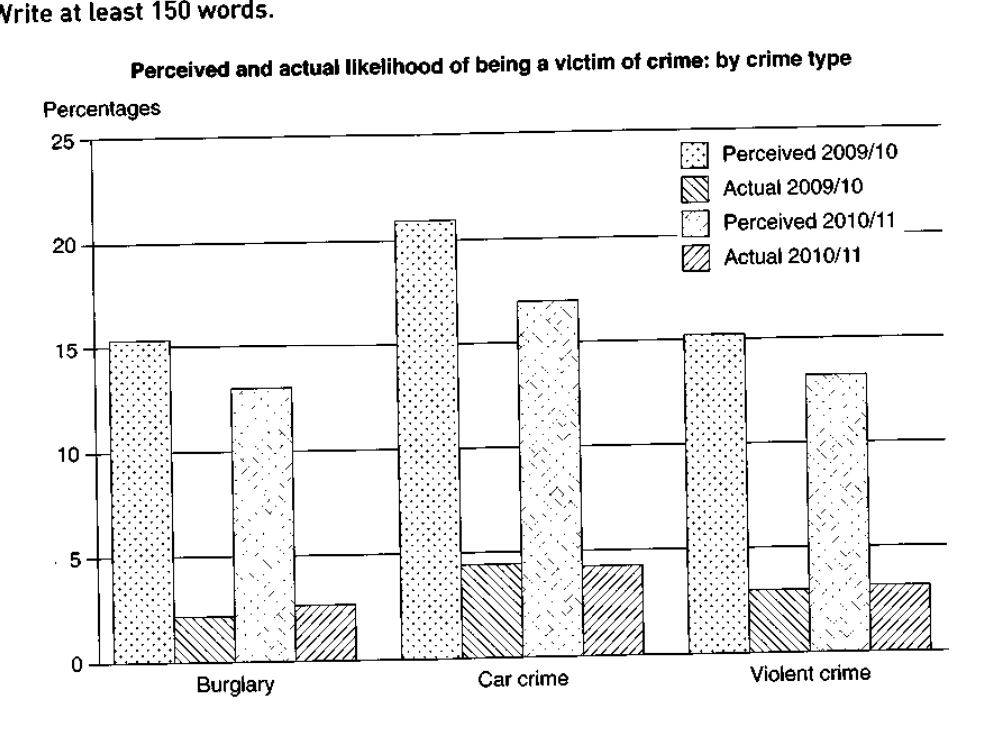
The graph below shows the perceived danger and actual likelihood of being a victim of crime.
Summarise the information by selecting and reporting the main features, and make comparisons where relevant.
Perceived and actual likelihood of being a victim of crime: by crime type
Student answer (Band 6.0)
The diagrams illustrate the perceived and acutal livelihood of being a victim of a crime. The diagramms are divided into three different crime types and for each crime type there is a result for the year 2009/10 and 2010/11.
What is particular striking over all three crime types is that the perceived crime rates are a lot higher than the actual crime rates.
The first crime type is burglary. The perceiving rate is peaked at slightly over 15% in 2009/10 but the actual crime rat is approximately at 2.5% in 2009/10. The vast majority of respondents perceived the likelihood of being a victim of crime way higher than it acutally is. In the year 2010/11 the perceived likelihhood of being a victim of crime substantial increased compared to the previous year.
Compared to the car crimes the vast of majority of the respondents was at over 20% in 2009/10 and the actual rate was at under 5% in 2009/10. Moreover in the year 2010/11 the perceived rate was high as well approximately at 16% and the actual crime rate stayed the same compared to the previous year. Compared to the crime type burglary that is different because at the burglary case the perceived rate went down but in the actual rate there was an substantial increase. In the car crime the actual rate remained broadly the same.
Furthermore in the third crime type "violent crime" the perceived rate was slightly over 15% while the actual rate was approximately at slightly over 12.5%. For instance in 2010/11 the perceived rate went down as well while there was an substantial increase in the acutal rate. To a certain extend we can compare the violent crime rates with the burglary crime rates, because both have the same patterns according the decrease in the perceived numbers and the substantial increase in the actual numbers.
Overall what is particular striking over all three crime types and results is that the vast majority of respondents perceived the likelihood of being a victim compared of being an actual victim higher.
AI examiner evaluation
| Criterion | Band |
|---|---|
| Task Achievement / Task Response | 6.0 |
| Coherence and Cohesion | 6.0 |
| Lexical Resource | 5.5 |
| Grammatical Range and Accuracy | 5.5 |
| Overall | 6.0 |
Task Achievement / Task Response: Band 6.0
You identify the central feature accurately: perceived likelihood is much higher than actual likelihood for all three crime types, and you compare the two years. However, several details are misreported, which limits the precision of the account. For burglary, perceived likelihood fell from about 15.5% to 13%, rather than increasing; actual likelihood rose only slightly, from about 2% to 2.5%. For violent crime, the actual figure was around 3% in 2009/10 and 3.5% in 2010/11, not over 12.5%. The car-crime figures are broadly represented, though the later perceived value is closer to 17%. A more accurate overview and careful checking of each trend would make the key comparisons clearer and better developed.
Coherence and Cohesion: Band 6.0
The response has a recognisable structure: an introduction, a general observation, paragraphs covering the crime types, and a concluding summary. This gives the reader an overall route through the information. However, progression is sometimes weakened by unclear or mechanical linking. For example, “Compared to the car crimes” begins a paragraph that then shifts between car crime and burglary, making the comparison difficult to follow. Repeated phrases such as “the perceived rate” and “the actual rate” also make the account feel repetitive, while “Moreover,” “Furthermore,” and “For instance” do not always signal the relationship between ideas precisely. Grouping the two years consistently within each crime type, and using clearer comparisons, would improve cohesion.
Lexical Resource: Band 5.5
You use a reasonable range of task-related vocabulary, including “perceived,” “actual,” “likelihood,” and “remained broadly the same,” so the main topic is generally clear. There are also attempts at more formal phrasing, such as “What is particular striking” and “the vast majority,” but several choices are inaccurate or unnatural. “Perceiving rate” is not an appropriate collocation, and “substantial increased” uses the wrong form. “Livelihood” changes the meaning of likelihood, while repeated use of “crime rate” sometimes obscures whether you mean perceived risk or actual victimisation. Spelling errors such as “acutal” and “diagramms” further reduce control. More precise chart language and careful proofreading would make your vocabulary more effective.
Grammatical Range and Accuracy: Band 5.5
You attempt both simple and complex sentences, including comparisons and clauses introduced by “while” and “because.” Most ideas remain understandable, but some grammatical errors recur. For example, “What is particular striking” needs an adverb, and “the vast of majority of the respondents was” has problems with both the phrase structure and subject–verb agreement. In “the perceived rate was high as well approximately at 16%,” the sentence structure is awkward, and “there was an substantial increase” has an article error. Some long sentences combine several comparisons without clear grammatical control. Aim for shorter, complete comparison sentences and check agreement, articles, and clause structure; this would improve accuracy while preserving your range.
See this exact question answered at other band scores. The same prompt compared across bands.
Browse more IELTS Writing model answers or get your own writing scored by the same AI examiner.