Band 5.5 IELTS Writing Task 1 Model Answer
Overall Band Score: 5.5 · IELTS Summit Mastery · 2026-11-09
IELTS Writing Task 1 question
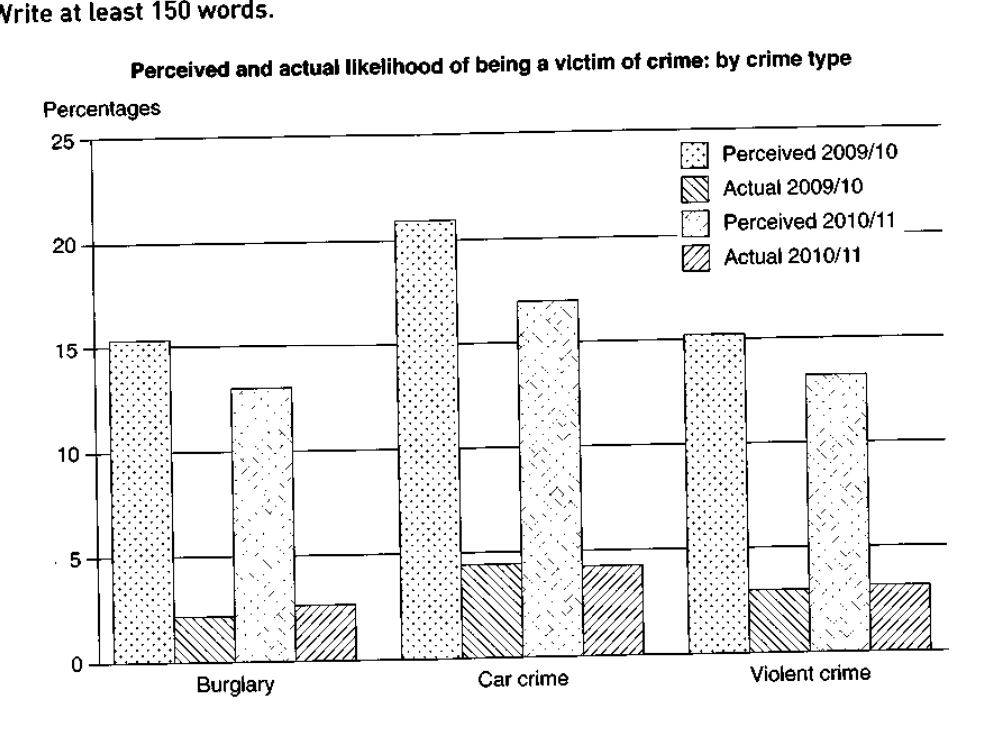
The graph below shows the perceived danger and actual likelihood of being a victim of crime.
Summarise the information by selecting and reporting the main features, and make comparisons where relevant.
Perceived and actual likelihood of being a victim of crime: by crime type
Student answer (Band 5.5)
The bar chart illustrates the real likelihood and perceived threat of being a victim of crime.
Overall, the perceived danger in 2009 and 2010 by car crime was recorded the highest, whereas the actual danger in 2009 and 2010 was recorded at lowest.
To start with, the ratio of the perceived danger by car crime was recorded over 20% in 2009 and 2010, that remained the highest in the graph. Similarly, the percentage of perceived danger in 2010 and 2011, was above15%. Subsequently, the ratio of the perceived danger by burglary in 2009 and 2010, was dropped to 15% similar to the ratio by violent crime in the following year. While, the data in 2010 and 2011 was also the same recorded near to 15% respectively.
Secondly, the proportion of the actual likelihood through car crime was near to 5% by 2009/10 and 2010/11 respectively. Similarly, the ratio dropped to 3% in viloent crime. In the last, actual likelihood of burglary in both years was recorded about 2% which was recorded the smallest in the chart.
AI examiner evaluation
| Criterion | Band |
|---|---|
| Task Achievement / Task Response | 5.5 |
| Coherence and Cohesion | 5.5 |
| Lexical Resource | 5.5 |
| Grammatical Range and Accuracy | 5.5 |
| Overall | 5.5 |
Task Achievement / Task Response: Band 5.5
You identify the chart’s central contrast: perceived risk is much higher than actual victimisation, and car crime has the highest figures in both measures. You also compare the three crime types and include approximate values. However, some details are inaccurate or unclear. Perceived car-crime risk was about 21% in 2009/10 and 17% in 2010/11, not over 20% in both years. The statement that burglary’s perceived figure “was dropped to 15%” is also misleading: it fell from about 15.5% to 13%. Your overview would be stronger if it clearly noted that perceived figures declined across all three categories, while actual figures rose slightly or stayed level. These gaps and imprecisions limit how fully the main features are reported.
Coherence and Cohesion: Band 5.5
The response has a recognisable structure, with an introduction, an overview, and separate discussion of perceived and actual likelihood. This helps the reader follow the broad comparison. However, progression within the perceived-risk paragraph is difficult to track: “Similarly,” “Subsequently,” and “While” do not always show the relationship between the figures clearly, and the sentence beginning “While” is incomplete. The repeated “ratio” and “recorded” phrasing also makes the account feel mechanical. Grouping each crime type’s perceived figures across both years, then comparing actual figures, or using a clear year-by-year pattern would make the organisation more consistent. Use linking expressions only when their logical relationship is clear.
Lexical Resource: Band 5.5
You use a reasonable range of chart-related vocabulary, including “illustrates,” “percentage,” “proportion,” and “actual likelihood,” and the reader can generally understand the comparisons. However, several word choices are unnatural or imprecise for describing this data. “Perceived threat” and “actual danger” do not match the chart’s measures as precisely as “perceived likelihood” and “actual likelihood,” while “ratio … by car crime” is an awkward collocation. “Was recorded the highest” is also not idiomatic, and “viloent” is misspelled. Repeating “ratio” and “recorded” limits flexibility. Prefer standard reporting language such as “stood at,” “was highest,” “fell,” and “remained stable” to describe values and trends accurately.
Grammatical Range and Accuracy: Band 5.5
You attempt both simple statements and more complex comparisons, and the main message is usually understandable. However, errors in sentence construction and punctuation recur. For example, “that remained the highest” does not connect grammatically to the preceding clause, and “While, the data…” is an incomplete subordinate clause. Commas also interrupt phrases unnecessarily, as in “in 2010 and 2011, was above15%.” Tense and verb patterns are sometimes faulty: “was dropped” should be “dropped” or “fell,” and “was recorded at lowest” needs a different construction. These issues make some sentences difficult to process. Build clearer complete clauses and check that each subordinate clause is attached to a main clause.
See this exact question answered at other band scores. The same prompt compared across bands.
Browse more IELTS Writing model answers or get your own writing scored by the same AI examiner.