Band 6.5 IELTS Writing Task 1 Model Answer
Overall Band Score: 6.5 · IELTS Summit Mastery · 2026-11-10
IELTS Writing Task 1 question
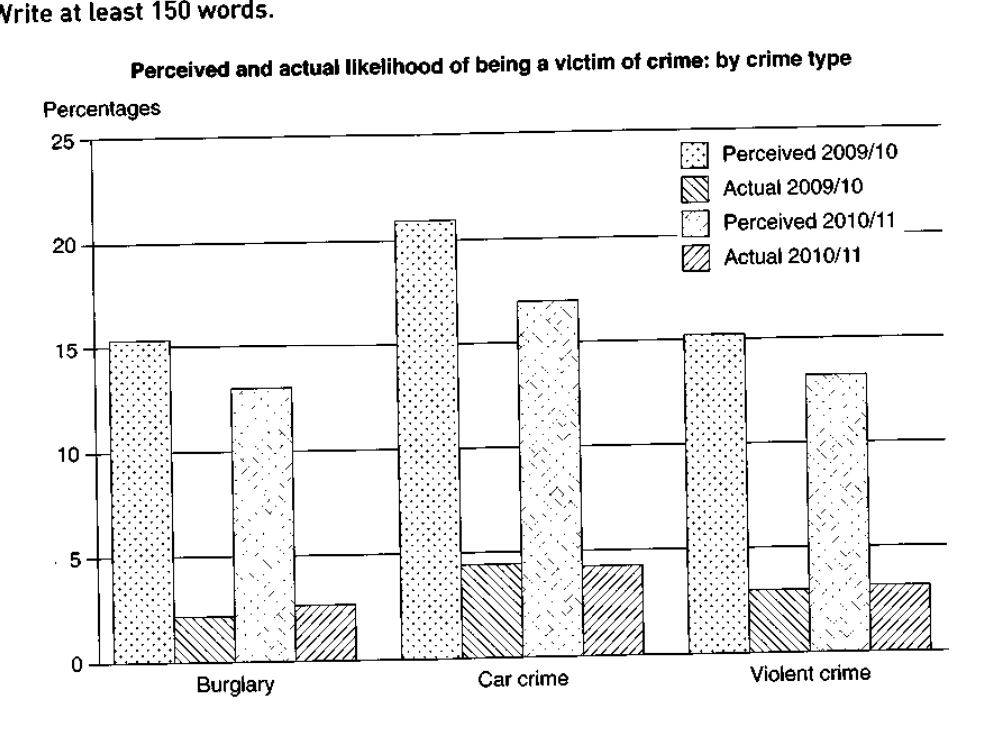
The graph below shows the perceived danger and actual likelihood of being a victim of crime.
Summarise the information by selecting and reporting the main features, and make comparisons where relevant.
Perceived and actual likelihood of being a victim of crime: by crime type
Student answer (Band 6.5)
The bar diagram compares perceived and actual probability of falling vicitim to 3 types of crimes ( burglary, car crime and violent crime) in [redacted phone] and [redacted phone].
Overall, it can be seen that percentage of perceived probability of becoming a victim is higher compared to the actual likelihood of haeppning for all three crime categories in both years, showing a general declining trend from 2009 to 2011. The proportions of people becoming actual victim to these crimes is relatively less.
Car crime recorded the highest percentage in perceived crimes, falling from above 22% in 2009 to around 17 % in 2011. Bulgary and Violent crime showed a similar trend, the perceived proability of being a victim for both fell from nearly 16% in 2009 to around 13% in 2011.
As for the actual crime happening, proportions of car crime victims decreased slighlty from 2009 at 4% to 2011 at 3.5 %. The percentage of actual victims of burglary and violent crime both increased by nearly 1% between the two years, with burglary victims increasing fro 2 % to 3, and violent crime victims from 3% to 4%.
AI examiner evaluation
| Criterion | Band |
|---|---|
| Task Achievement / Task Response | 6.5 |
| Coherence and Cohesion | 7.0 |
| Lexical Resource | 6.0 |
| Grammatical Range and Accuracy | 6.0 |
| Overall | 6.5 |
Task Achievement / Task Response: Band 6.5
You identify the main contrast clearly: perceived risk is much higher than actual victimisation in all three categories, and car crime has the highest perceived figure. You also report the broad fall in perceived figures and the small changes in actual figures, so the response covers the key features. Some details, however, are inaccurate: perceived car crime is about 21% in 2009/10, not above 22%, and actual car crime stays around 4.5% in both years rather than falling to 3.5%. The actual burglary and violent-crime figures rise only slightly, to about 2.5% and 3.5%, not 3% and 4%. The overview is relevant, but more precise reporting of these comparisons would make the account more fully supported.
Coherence and Cohesion: Band 7.0
The response is organised into a clear introduction, overview and two detail paragraphs. Its progression from perceived likelihood to actual likelihood is logical, and phrases such as “Overall” and “As for” help signal the shift between sections. The comparisons within each paragraph are generally easy to follow. To make the organisation more polished, keep the time labels consistent and use more precise links between the figures and their changes; for example, the actual car-crime figure is described as decreasing even though the chart shows it remaining stable. Some sentence connections are also slightly abrupt, but the overall progression is clear and the paragraphing is effective.
Lexical Resource: Band 6.0
You use a suitable range of task-related vocabulary, including “perceived probability,” “actual likelihood,” “recorded the highest percentage” and “fell from … to …”. These expressions allow you to describe the chart and make comparisons. However, some word choices and collocations are inaccurate or awkward, such as “falling vicitim to,” “actual crime happening” and “proportions of people becoming actual victim.” Spelling errors, including “vicitim,” “Bulgary,” “proability” and “slighlty,” also reduce accuracy. Aim for standard chart language such as “becoming a victim,” “actual victimisation” and “the proportion of victims.” This would make your adequate vocabulary more precise and natural without requiring unnecessarily complex terms.
Grammatical Range and Accuracy: Band 6.0
You use a mix of simple and more complex sentence forms, including the overview clause “showing a general declining trend” and comparisons with “falling from … to …”. Most sentences communicate the intended meaning, but some grammatical errors remain. For example, “percentage of perceived probability … is higher” needs an article or plural agreement, and “the proportions … is” has a subject–verb agreement error. The phrase “both fell” is followed by a singular construction in “the perceived probability … for both fell,” which makes the relationship less clear. There are also inconsistent time references and some punctuation spacing issues. Check articles, agreement and sentence structure when editing; greater control of these patterns would improve accuracy while preserving your range.
See this exact question answered at other band scores. The same prompt compared across bands.
Browse more IELTS Writing model answers or get your own writing scored by the same AI examiner.