Band 5.5 IELTS Writing Task 1 Model Answer
Overall Band Score: 5.5 · IELTS Summit Mastery · 2026-11-10
IELTS Writing Task 1 question
The graph below shows the perceived danger and actual likelihood of being a victim of crime.
Summarise the information by selecting and reporting the main features, and make comparisons where relevant.
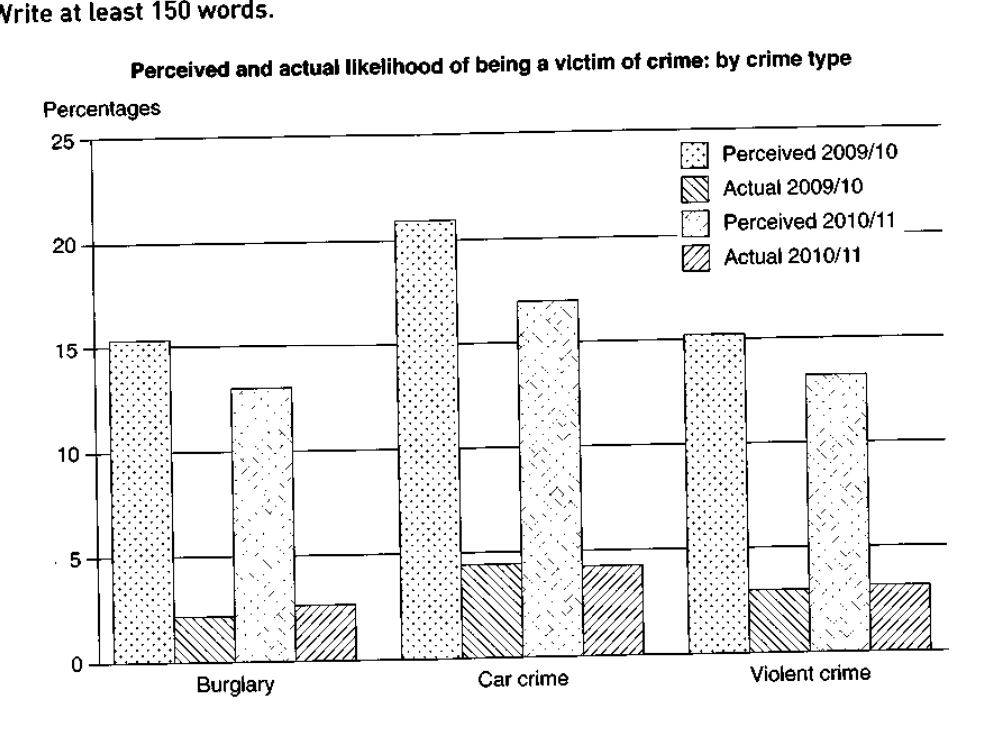
Perceived and actual likelihood of being a victim of crime: by crime type
Student answer (Band 5.5)
The line graph illustrates the dangers and current likelihood of being crime's victim by different types of crime.
Overall, percieved crimes of 2009_10 recorded the highest rates in all types and peaked on car crimes compared to the actual ones of 2009_10.
Perceived crimes of 2009_10 started with around 15% in bulgary to surge after and peak at more than 20% in term of car crime, to drop suddenly again at 15% in violent, followed by the perceived ones of 2010_11 which ranked second with 13% roughly and increased slightly to over than 15% in car crime and decreased after at under than 14%.
It is obvious that the actual rates are less than the previous ones, burgary saw the lowest proportion with less than 2%, to double in car crimes to 4%, and went down again into approximately 3%. Moreover, the actual rates of 2010-11 registred also lowest figures with less than 5% in all types expect car crimes when the percentage was around 3%
AI examiner evaluation
| Criterion | Band |
|---|---|
| Task Achievement / Task Response | 6.0 |
| Coherence and Cohesion | 5.5 |
| Lexical Resource | 5.5 |
| Grammatical Range and Accuracy | 5.0 |
| Overall | 5.5 |
Task Achievement / Task Response: Band 6.0
You identify the main contrast accurately: perceived likelihood is much higher than actual victimisation, and car crime is the highest category in both perceived series. You also report the broad decline in perceived figures from 2009/10 to 2010/11. However, some details are unclear or inaccurate: the 2009/10 perceived figures do not simply “start” at 15% and rise; burglary and violent crime are both about 15.5%, with car crime around 21%. The actual figures for 2010/11 are also misreported: they are about 2.5%, 4.5% and 3.5%, rather than “less than 5%” with car crime around 3%. A clearer overview of the overall gap and the small changes in actual rates would make the summary more complete.
Coherence and Cohesion: Band 5.5
The response has a recognisable structure, moving from an introduction and overview to perceived figures and then actual figures. This gives the reader a basic route through the information. However, progression within the body is sometimes difficult to follow because several comparisons are packed into long sentences, especially the sentence beginning “Perceived crimes of 2009_10 started…”. The phrase “followed by the perceived ones” does not clearly explain how the two years relate, and “the previous ones” has an uncertain reference. Use separate paragraphs for perceived and actual data, and make each sentence compare the same crime category across years or the same year across categories. This would improve the clarity of links between details.
Lexical Resource: Band 5.5
You use some relevant chart vocabulary, including “peaked”, “proportion”, “percentage” and “rates”, and the reader can generally understand the intended comparisons. However, several word choices and collocations are inaccurate or unnatural, such as “dangers”, “crime’s victim”, “perceived crimes” and “in term of car crime”. There are also spelling errors, including “percieved”, “bulgary”, “burgary” and “registred”, which reduce precision. Prefer language that describes likelihood rather than crimes themselves, and use consistent labels such as “perceived likelihood” and “actual rate”. A more accurate range of terms would help you report the chart without awkward phrasing.
Grammatical Range and Accuracy: Band 5.0
You attempt both simple and more complex sentence forms, including clauses linked with “which”, “followed by” and “when”. However, complex sentences are often not controlled successfully. For example, “burgary saw the lowest proportion … to double in car crimes” leaves the relationship between the clauses unclear, while “which ranked second with 13% roughly and increased slightly” has an unclear subject. There are also problems with articles, plurals and sentence boundaries, as in “the actual ones” and the long sentence describing the perceived figures. Aim for shorter, complete sentences with a clear subject and verb, and check that each comparison has a grammatical structure. This would make the data easier to interpret.
See this exact question answered at other band scores. The same prompt compared across bands.
Browse more IELTS Writing model answers or get your own writing scored by the same AI examiner.