Band 5.5 IELTS Writing Task 1 Model Answer
Overall Band Score: 5.5 · IELTS Summit Mastery · 2026-11-11
IELTS Writing Task 1 question
The graph below shows the perceived danger and actual likelihood of being a victim of crime.
Summarise the information by selecting and reporting the main features, and make comparisons where relevant.
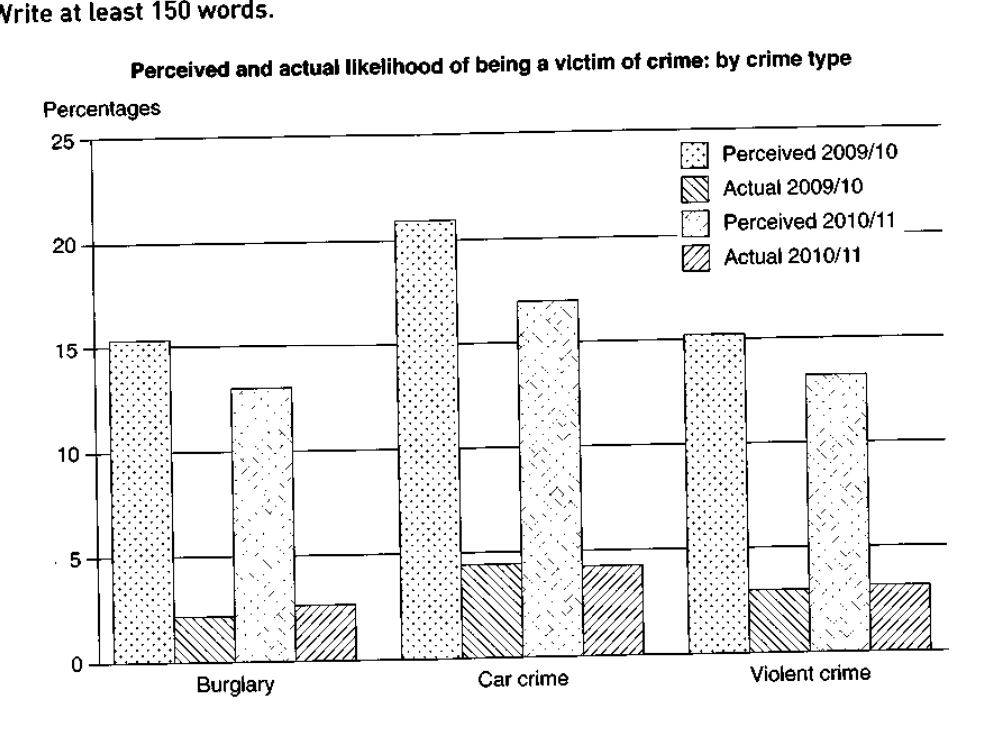
Perceived and actual likelihood of being a victim of crime: by crime type
Student answer (Band 5.5)
The bar graph presents the sense of threat and real likelihood being a person who is tricked by crime.
Overall, the graph shows us three different types of crimes happening during 2009 to 2011, period during 2009\10 being the vehicle crime victims were perceived at its highest while the probability of being actual victim in every crime type was lower than chance of observed victim.
First of all, the graph tells us that during 2009\10 period in terms of observing likelihood of burglary was at 15 while during 2010\11 it goes down. In auto crime being the perceived number of victims were highest among all crime at approximately 22 during 2009\10.Then next year it goes slight down with approximately 17 victims in a year. Violent crime being assumed victims during 2009 were 15 times a year. Next year it goes down to 12.
Coming to genuine chances of being a targeted person in burglary crime were lowest in all the crime at approximately 2 in the period of 2009\10 year but next year it adds up to 1 victim more than previous. The genuine chances of being victim in car crime was at 4 during 2009\10 It become stable in upcoming years. Furthermore in violent crime it was also stable at 3 during all years
AI examiner evaluation
| Criterion | Band |
|---|---|
| Task Achievement / Task Response | 5.5 |
| Coherence and Cohesion | 5.5 |
| Lexical Resource | 5.5 |
| Grammatical Range and Accuracy | 5.0 |
| Overall | 5.5 |
Task Achievement / Task Response: Band 5.5
You identify the chart’s three crime categories and make the important overall comparison that perceived risk was much higher than actual victimisation. You also report several relevant figures, including car crime as the most feared category and the low actual burglary rate. However, some details are inaccurate or unclear: perceived violent crime is about 15.5% in 2009/10 and 13.5% in 2010/11, not “15 times” and “12”; actual violent crime rises from about 3% to 3.5%, rather than remaining stable. The overview also says the period runs from 2009 to 2011, which is imprecise for the two labelled years. A clearer summary of the main trends, supported by accurate comparisons across both years, would make the response more complete.
Coherence and Cohesion: Band 5.5
The response has a recognisable structure: an introduction and overview are followed by paragraphs on perceived and actual risk. This helps the reader distinguish the two measures, and transitions such as “First of all” and “Furthermore” show an attempt to connect points. However, progression within the paragraphs is sometimes difficult to follow because several comparisons are compressed into awkward sentences, and the sequence of crime types is not consistently signposted. Punctuation also causes ideas to run together, as in “during 2009\10.Then next year”. Some linking phrases, including “Coming to genuine chances”, sound mechanical rather than guiding the comparison. Organise each paragraph around a clear comparison across the two years and use simpler, more precise transitions.
Lexical Resource: Band 5.5
You use some task-related vocabulary, including “perceived”, “actual”, “likelihood”, “burglary” and “violent crime”, so the reader can generally identify the chart’s subject. There is also an attempt to vary wording with “genuine chances” and “assumed victims”. However, several choices are inaccurate or unnatural and sometimes obscure the intended meaning: “a person who is tricked by crime”, “auto crime”, and “targeted person” do not describe the chart’s categories clearly. “Victims” is also used where a percentage or likelihood is meant, and “adds up to 1 victim more” is imprecise. Aim for consistent, standard terms such as “perceived risk”, “actual victimisation” and “percentage”, and avoid substituting unusual phrases for the chart labels.
Grammatical Range and Accuracy: Band 5.0
You attempt both simple and more extended sentence forms, including comparisons between the two periods. However, control is uneven, and errors in sentence structure, agreement, tense and punctuation frequently make the meaning harder to follow. For example, “the probability of being actual victim in every crime type was lower than chance of observed victim” lacks clear grammatical relationships, while “In auto crime being the perceived number of victims were highest” has faulty clause structure and agreement. Articles and prepositions are also often missing, as in “being a person” and “in burglary crime”. Several sentences run together without a space or full stop. Practise building accurate subject–verb sentences first, then add comparisons using controlled clauses such as “The perceived risk of car crime was higher in 2009/10 than in 2010/11.”
See this exact question answered at other band scores. The same prompt compared across bands.
Browse more IELTS Writing model answers or get your own writing scored by the same AI examiner.