Band 5.5 IELTS Writing Task 1 Model Answer
Overall Band Score: 5.5 · IELTS Summit Mastery · 2026-11-11
IELTS Writing Task 1 question
The graph below shows the perceived danger and actual likelihood of being a victim of crime.
Summarise the information by selecting and reporting the main features, and make comparisons where relevant.
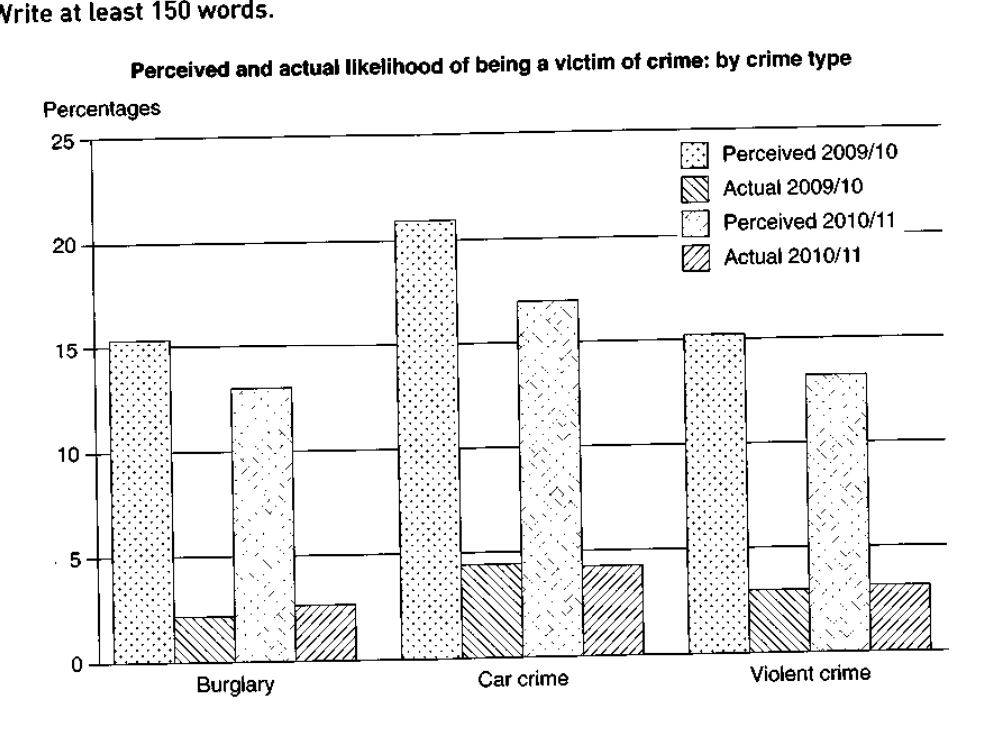
Perceived and actual likelihood of being a victim of crime: by crime type
Student answer (Band 5.5)
The bar chart illustrates the danger felt by people and really becoming a victim of it.
Overall, the perceived danger rate was high throughout 2009, 2010 and 2011 years in burglary, car crime and violent crime while the actual crime rate was lower in all aspects but slightly high in car crime.
From 2009 to 2010 the perceived crime rate in burglary was slightly higher than 15 percent, the car crime crossing 20 percent and violent crime around 15 percent. Whereas in 2010 and 2011 the perceived crime rate in burglary and violent crime was less than 15 percent where the car crime crime crossed 15 percent.
The actual danger remained less than 5 percent in all these three years but car crime almost touched 5 percent increasing slightly from burglary and violent crime.
AI examiner evaluation
| Criterion | Band |
|---|---|
| Task Achievement / Task Response | 5.5 |
| Coherence and Cohesion | 5.5 |
| Lexical Resource | 5.5 |
| Grammatical Range and Accuracy | 5.5 |
| Overall | 5.5 |
Task Achievement / Task Response: Band 5.5
You identify the chart’s central contrast: perceived risk is much higher than actual victimisation for all three crime types, and car crime is highest in both measures. You also report several approximate figures, such as perceived car crime being above 20% in 2009/10 and actual rates remaining below 5%. However, the overview refers to “2009, 2010 and 2011 years,” although the chart compares only 2009/10 and 2010/11, and it does not clearly summarise the overall decline in perceived rates. The actual figures are described only generally, so important comparisons are underdeveloped. The response is also 16 words below the required minimum. Include a clearer overview and compare the two periods with accurate, specific figures.
Coherence and Cohesion: Band 5.5
The response has a basic, useful structure: an introduction, an overview, and paragraphs covering perceived and actual crime. This makes the main distinction between the two measures reasonably easy to follow. However, progression within the body is limited, and the comparison between periods is compressed into one sentence beginning “Whereas,” which is not joined to a complete main clause. The repeated use of “crime rate” and the vague phrase “in all these three years” also make connections less precise. Organise the details more clearly by comparing each period or grouping perceived and actual figures, and use linking expressions to show changes and contrasts without relying on fragments.
Lexical Resource: Band 5.5
You use relevant chart vocabulary, including “perceived,” “actual,” “rate,” and “increasing,” and the reader can generally understand the comparisons. However, the range is limited and some expressions are imprecise or unnatural: “danger felt by people,” “really becoming a victim,” and “slightly high” do not describe the chart’s measures clearly. “Crime rate” is also repeated, while “crossing” is not the most accurate choice for reporting a value. Use more precise terms such as “perceived likelihood,” “actual victimisation,” and “stood at” or “reached.” Avoid repetition and choose collocations that distinguish perceived risk from recorded likelihood.
Grammatical Range and Accuracy: Band 5.5
You attempt both simple and more complex sentence forms, and most of the intended meaning can be understood. However, some sentence structures are incomplete or awkward. “Whereas in 2010 and 2011…” is a dependent clause presented as a sentence, and “the car crime crossing 20 percent” lacks a finite verb. The phrase “in 2009, 2010 and 2011 years” also has an inaccurate time construction, and “the car crime crime” contains an obvious repetition. Use complete clauses, check verb forms, and refer consistently to the chart’s two periods. A wider range of accurately controlled sentences would make the comparisons clearer.
See this exact question answered at other band scores. The same prompt compared across bands.
Browse more IELTS Writing model answers or get your own writing scored by the same AI examiner.