Band 4.0 IELTS Writing Task 1 Model Answer
Overall Band Score: 4.0 · IELTS Summit Mastery · 2026-11-11
IELTS Writing Task 1 question
The graph below shows the perceived danger and actual likelihood of being a victim of crime.
Summarise the information by selecting and reporting the main features, and make comparisons where relevant.
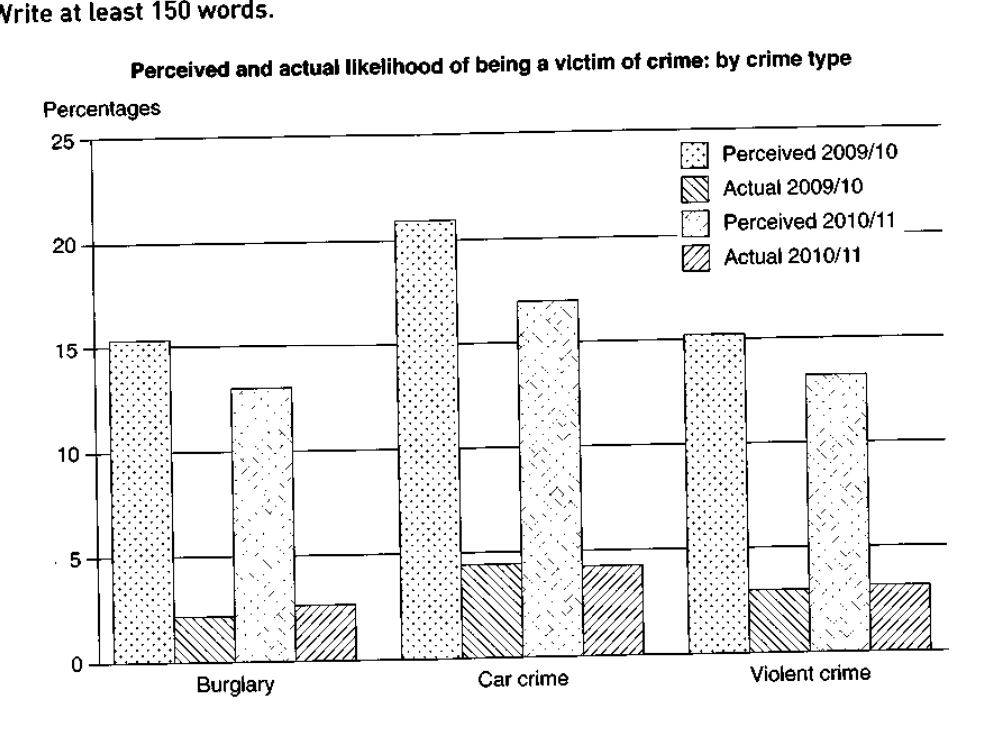
Perceived and actual likelihood of being a victim of crime: by crime type
Student answer (Band 4.0)
The given graph shows the trend of perceived and actual likelihood of being a victim of crime from 2009 to 2011.
Graph shows percived and actual percentage of crime for 2009 and 2010. Three types of crime is mentioned in the graph which is burglary, car crime and violent crime where percentage of percieved is high among all three crimes between 2009 and 2011 where actual graph is less among all.
Graph of Car crime precived in 2009/10 shows highest 22% percentage from 2009 to 2011 where burglary and violent both were 15% while burglary actual crime was less with o.25% among all other crimes. Car crime percieved in
AI examiner evaluation
| Criterion | Band |
|---|---|
| Task Achievement / Task Response | 4.0 |
| Coherence and Cohesion | 3.5 |
| Lexical Resource | 4.5 |
| Grammatical Range and Accuracy | 4.5 |
| Overall | 4.0 |
Task Achievement / Task Response: Band 4.0
You identify the chart’s subject and name all three crime types, and you make the relevant broad comparison that perceived risk is higher than actual victimisation. However, the response is incomplete and does not provide a clear overview of the main patterns across both years. It gives only a few figures, and the claim that burglary’s actual rate was “0.25%” is inaccurate; the chart shows about 2% in 2009/10 and 2.5% in 2010/11. The final sentence breaks off, leaving the comparison unfinished. The response is also 51 words below the required minimum, which limits the detail and coverage. To improve, complete the summary and report the overall decline in perceived risk, alongside the broadly stable, much lower actual rates.
Coherence and Cohesion: Band 3.5
There is a basic attempt to organise the response: an opening identifies the chart, followed by a paragraph naming the crime categories and comparing perceived with actual risk. This gives the reader a general direction. However, the ideas do not progress into a complete account: the final paragraph starts a comparison of car crime and then ends mid-sentence at “Car crime percieved in”. The repeated use of “graph” and the unclear phrase “where actual graph is less among all” also make connections between points difficult to follow. Use a clear overview paragraph, then group comparisons by perceived and actual figures or by year, and finish each comparison. Check that each sentence links logically to the next.
Lexical Resource: Band 4.5
Your vocabulary is sufficient to identify the topic and categories, with terms such as “perceived,” “actual,” “burglary,” and “violent crime.” However, the range is basic and repetitive, especially through repeated use of “graph,” “crime,” and “percentage.” Several spelling errors, including “percived” and “percieved,” reduce accuracy, while phrases such as “actual graph” and “highest 22% percentage” are not natural ways to describe chart data. Aim for precise reporting language and vary expressions for rates and comparisons. For example, use “the perceived likelihood” or “the perceived rate,” and describe a figure as “approximately 22%” rather than “22% percentage.”
Grammatical Range and Accuracy: Band 4.5
The response uses some simple sentence forms and attempts to connect ideas with “where,” but grammatical control is uneven. For example, “Three types of crime is mentioned” has a subject–verb agreement error, and “which is burglary, car crime and violent crime” does not fit smoothly into the sentence. The opening phrase “Graph shows” also lacks an article, and the final sentence is incomplete, so its grammatical meaning cannot be followed. Most structures are simple, with little evidence of controlled variety. Practise accurate sentence patterns such as “The chart compares three types of crime” and “Perceived rates were higher than actual rates in both years.” Then proofread agreement, articles, and sentence completion.
See this exact question answered at other band scores. The same prompt compared across bands.
Browse more IELTS Writing model answers or get your own writing scored by the same AI examiner.