Band 5.5 IELTS Writing Task 1 Model Answer
Overall Band Score: 5.5 · IELTS Summit Mastery · 2026-11-12
IELTS Writing Task 1 question
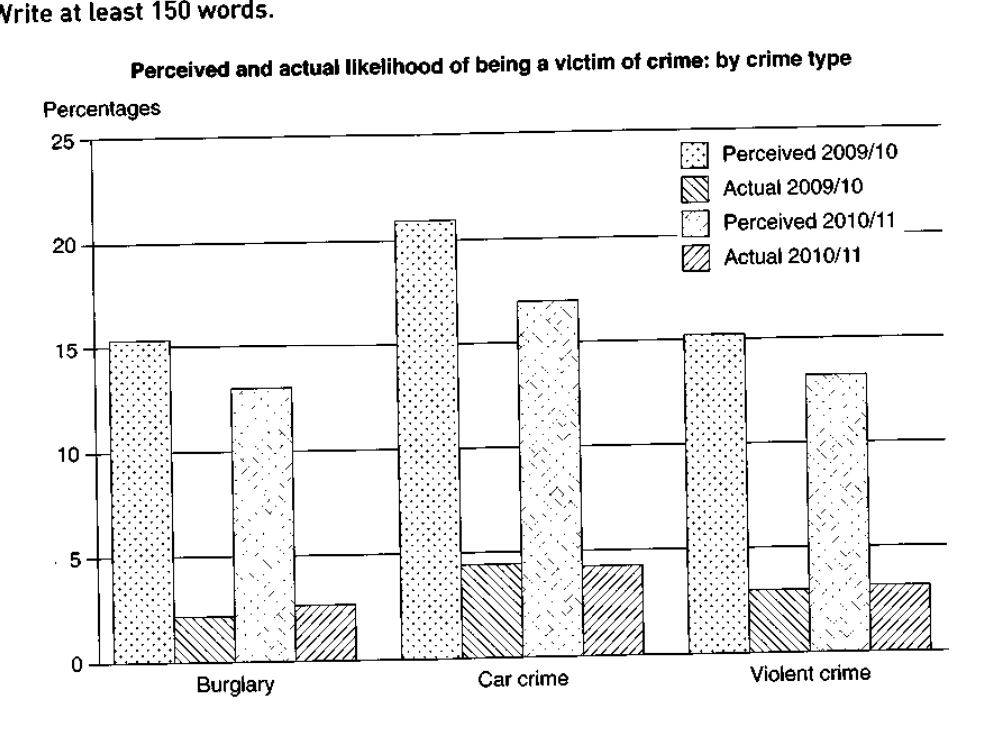
The graph below shows the perceived danger and actual likelihood of being a victim of crime.
Summarise the information by selecting and reporting the main features, and make comparisons where relevant.
Perceived and actual likelihood of being a victim of crime: by crime type
Student answer (Band 5.5)
The bar graph explains the perceived danger and in actual mode being a victim of crime by three crime types in two specific durations 2009/10 and 2010/11.
Overall, Car crime accounted for higher percentage in all years as compared to other crimes. Burglary and violent crime were moderate in terms of percentage.On the other side, percieved a danger was higher in contrast to being a real victim.
In 2009/10, perceived danger accounted for highest in car crime which was upto 20% while burglary and violent crime accounted for an equal figure of almost 15%. As well as, real evil was also overviewed as the highest figure of approximately 4%, meanwhile unregulated crime and burglary were almost 3% and 2% respectively.
In 2010/11, most of the values were almost parallel than that in 2009/10. Perceive danger was high in car crime of about 17% by following violent crime and burglary at 13% and almost 12 % respectively. In term of actual accidents , car crime, violent crime and burglary were in a respective manner of 4% , 3% and 2%.
AI examiner evaluation
| Criterion | Band |
|---|---|
| Task Achievement / Task Response | 6.0 |
| Coherence and Cohesion | 6.0 |
| Lexical Resource | 5.0 |
| Grammatical Range and Accuracy | 5.5 |
| Overall | 5.5 |
Task Achievement / Task Response: Band 6.0
You identify the main pattern: perceived risk is much higher than actual victimisation, and car crime has the highest figures in both periods. The response also compares the three crime types across the two years and includes relevant approximate values. However, some figures are inaccurate or unclear: for 2009/10, actual car crime is about 4.5%, not “approximately 4%,” and the phrase “real evil” makes the category difficult to identify. In 2010/11, perceived burglary is about 13%, rather than almost 12%. The overview is relevant but calls burglary and violent crime “moderate” without clearly summarising their similar levels or the small changes between years. More precise reporting and a clearer overview would strengthen coverage.
Coherence and Cohesion: Band 6.0
The response has a clear overall arrangement: an introduction, an overview, and separate paragraphs for 2009/10 and 2010/11. This makes the broad comparison easy to follow, and phrases such as “In 2009/10” and “In 2010/11” provide useful signposting. Cohesion is less successful within some sentences, however. “As well as” does not clearly connect the perceived and actual figures, while “meanwhile” introduces a comparison whose categories are hard to identify. The overview’s “On the other side” is also an awkward transition. Use straightforward links such as “By contrast” and keep each comparison’s categories explicit. This would make the progression more natural and reduce the effort needed to interpret the data.
Lexical Resource: Band 5.0
You use some task-relevant vocabulary, including “perceived danger,” “percentage,” “figure,” and “actual,” and you attempt to vary your wording. However, several choices are inaccurate or unnatural for describing a chart, which limits precision: “real evil” does not name actual victimisation, “actual accidents” changes the meaning, and “in a respective manner” is not a natural way to list values. There are also spelling and word-form slips, including “percieved” and “Perceive.” Prefer standard chart language and repeat a precise term when needed rather than substituting an unsuitable synonym. For example, use “actual victimisation” consistently and describe values as “stood at” or “was approximately.”
Grammatical Range and Accuracy: Band 5.5
You attempt both simple and more extended sentence forms, and the time-based paragraphs generally use past-tense reporting. Some grammatical errors remain, though the main message is usually understandable. For example, “in two specific durations” uses an unsuitable grammatical pattern, and “Car crime accounted for higher percentage” is missing an article. In “Perceive danger was high,” the verb form does not agree with the intended noun phrase; “perceived risk was highest” would be clearer. Punctuation and spacing are also inconsistent, as in “percentage.On” and the spaces around commas in the final paragraph. Check articles, noun phrases, and sentence boundaries, and favour controlled comparisons over long constructions.
See this exact question answered at other band scores. The same prompt compared across bands.
Browse more IELTS Writing model answers or get your own writing scored by the same AI examiner.