Band 6.0 IELTS Writing Task 1 Model Answer
Overall Band Score: 6.0 · IELTS Summit Mastery · 2026-11-12
IELTS Writing Task 1 question
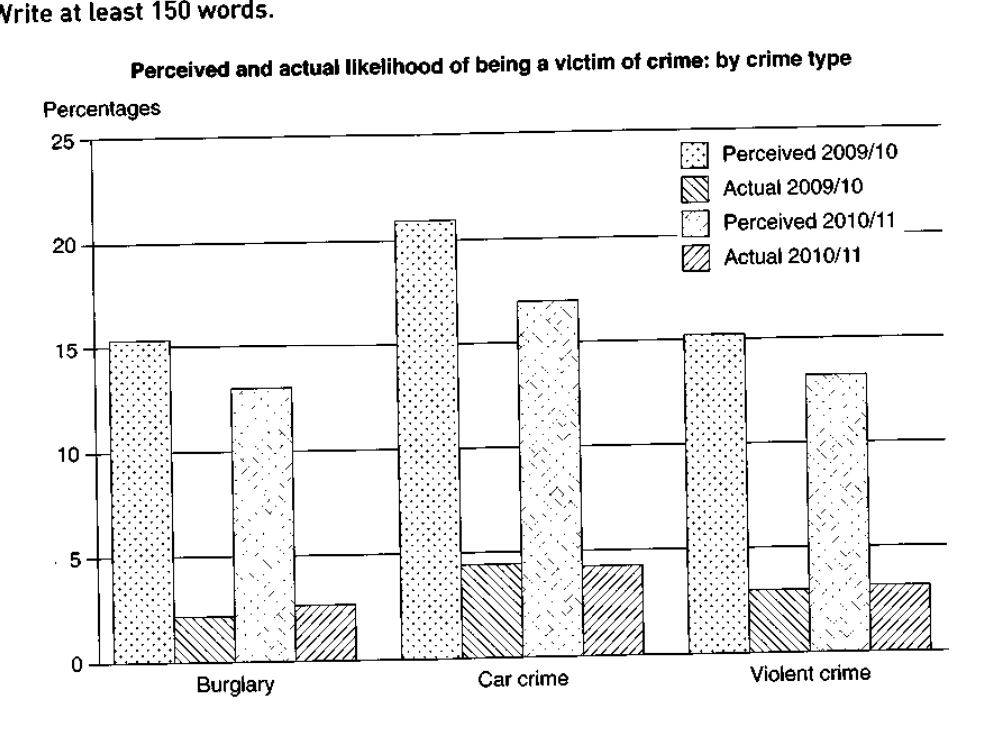
The graph below shows the perceived danger and actual likelihood of being a victim of crime.
Summarise the information by selecting and reporting the main features, and make comparisons where relevant.
Perceived and actual likelihood of being a victim of crime: by crime type
Student answer (Band 6.0)
The provided bar graph illustrates the prediction and the actual ration of being a victim of crime.
Overall, it can be seen that the forecasted crime proportion was more than actual crime victims highest preceived crime was car cime for 2009/10 and least actual crime was burglary in 2009/10.
To begin with, predicted for burgulary for 2009/10 was just above 15% and actual victims were around 2% and forecasted percentage of crime victims in 2010/11 was about 13% and actual proportion was little more than 2%. Car cime was preceived to be more than 20% in 2009/10 but actual percentage came out nearly 5%, while, prediction for 2010/11 was approximately 17% and victim proportion was around 4.5%.
Furthermore, the forecasted percentage for 2009/10 of violent crime was just above 15% and actual numbers turn out to be just 3.5%. Finally, around 14% violent crimes were predicted for 2010/11 and actual crimes were around 3.5%.
AI examiner evaluation
| Criterion | Band |
|---|---|
| Task Achievement / Task Response | 6.0 |
| Coherence and Cohesion | 6.5 |
| Lexical Resource | 5.5 |
| Grammatical Range and Accuracy | 5.5 |
| Overall | 6.0 |
Task Achievement / Task Response: Band 6.0
You identify the main overall contrast: perceived likelihood is much higher than actual victimisation, and car crime has the highest perceived figures. You also report most category values and compare both periods, so the response addresses the chart. However, some details are inaccurate or unclear: actual violent crime in 2009/10 is about 3%, not 3.5%, and the 2010/11 actual figure is also about 3.5%. The overview’s claim that burglary was the “least actual crime” applies only to 2009/10; in 2010/11 it remains the lowest, but this could be stated more clearly. The overview also omits the general fall in perceived figures between years and the slight rise in actual figures. A more complete overview and precise reporting would strengthen the response.
Coherence and Cohesion: Band 6.5
The response has a clear overall structure: an introduction, an overview, and two detail paragraphs. The sequence from burglary and car crime to violent crime is easy to follow, and signposts such as “To begin with,” “Furthermore,” and “Finally” help guide the reader. This gives the report coherent organisation and some effective progression. However, the overview sentence is difficult to interpret, particularly “the forecasted crime proportion was more than actual crime victims highest perceived crime,” and the final paragraph’s “Finally” makes the category sequence feel slightly mechanical. Grouping the figures more consistently by year or comparing all three categories within each period would make the relationships clearer and cohesion more flexible.
Lexical Resource: Band 5.5
You use relevant chart vocabulary, including “actual,” “predicted,” “percentage,” and “victims,” and you attempt alternatives such as “forecasted” and “perceived.” This provides enough language to communicate the main comparisons. However, several spelling errors and imprecise or unnatural expressions reduce accuracy: “ration” for “rate,” “preceived,” “burgulary,” and “car cime” are noticeable, while “actual numbers turn out to be” is not a natural way to describe the chart. Repeating “forecasted” and “actual” also limits flexibility. Use standard terms consistently, such as “perceived likelihood,” “actual victimisation rate,” and “stood at,” and check spelling carefully. More precise collocations would make the report sound clearer and more academic.
Grammatical Range and Accuracy: Band 5.5
You use both simple statements and longer sentences with clauses, for example the comparison beginning “Car crime was perceived to be more than 20% … but actual percentage came out nearly 5%.” This shows some range, and the intended comparisons are generally understandable. Some grammatical errors remain, especially in the overview: “the forecasted crime proportion was more than actual crime victims highest perceived crime” lacks a clear sentence structure. There are also problems with articles and phrasing, as in “actual proportion was little more than 2%,” and the comma before “while” is unnecessary in the car-crime sentence. Aim to build each comparison around a clear subject and verb, and use parallel forms for perceived and actual figures. This would improve control without sacrificing sentence variety.
See this exact question answered at other band scores. The same prompt compared across bands.
Browse more IELTS Writing model answers or get your own writing scored by the same AI examiner.