Band 6.5 IELTS Writing Task 1 Model Answer
Overall Band Score: 6.5 · IELTS Summit Mastery · 2026-11-13
IELTS Writing Task 1 question
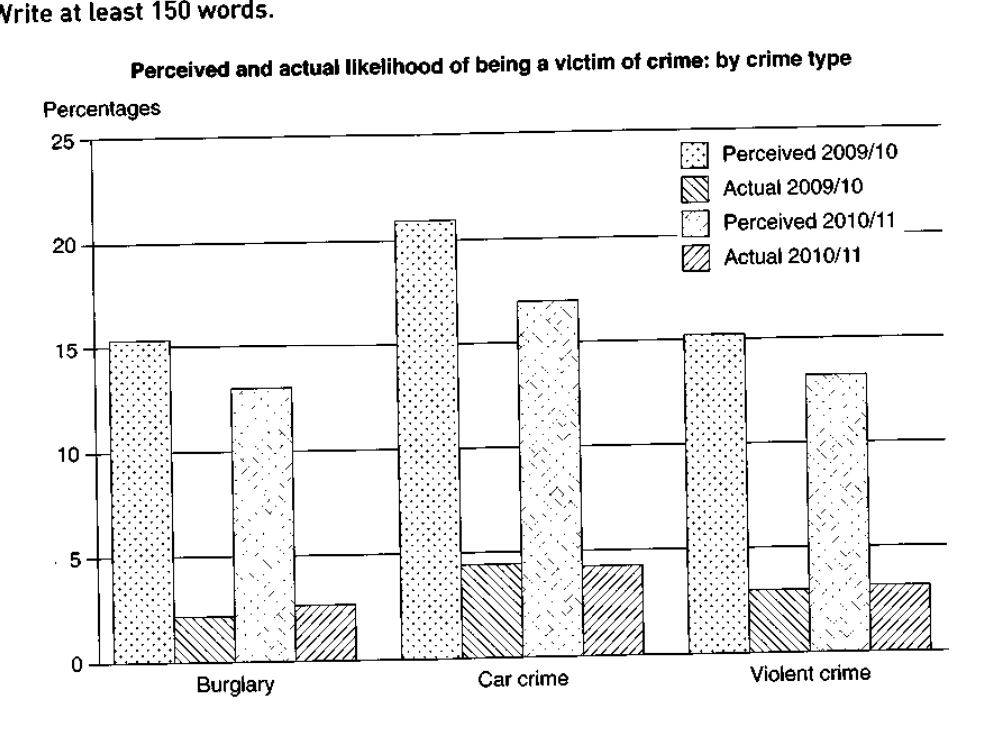
The graph below shows the perceived danger and actual likelihood of being a victim of crime.
Summarise the information by selecting and reporting the main features, and make comparisons where relevant.
Perceived and actual likelihood of being a victim of crime: by crime type
Student answer (Band 6.5)
The bar graph illustrates the perceived danger and actual likelihood of being a vicim of crime in three different categories.
Overall, it is clear that the perceived crime was much higher than the actual crime for all the three categories for 2009/10 and 2010/11. Car crime accounted for the highest proportion for perceived and actual crime for both the years, whereas Burglary and violent crime shoed relatively similar figures.
To begin with, in 2009/10, Burglary perceived 15% crime, whereas the actual crime rate was just 2%. Similarly, in 2010/11, a decline is seen for perceived crime for Burglary at 13%, while the actual crime increased slightly to 3%. A similar pattern is seen for violent crime, where the perceived crime dropped from 15% in 2009/10 to 13% in 2010/11. However, the actual crime rates remained stable at 3% for both the years.
Turning to the remaining data, car crime received the highest number of perceived and actual rates. In 2009/10 car crime perceived 21% which fell to 17% by 2010/11. Moreover, the actual crime rate was approximately 4% for both the years.
AI examiner evaluation
| Criterion | Band |
|---|---|
| Task Achievement / Task Response | 7.0 |
| Coherence and Cohesion | 7.0 |
| Lexical Resource | 6.0 |
| Grammatical Range and Accuracy | 6.0 |
| Overall | 6.5 |
Task Achievement / Task Response: Band 7.0
You provide a clear overview of the main contrasts: perceived likelihood is much higher than actual likelihood in every category, and car crime is highest in both measures. The body also reports the broad declines in perceived burglary, violent crime and car crime. This supports a well-focused response to the chart. A few details are less precise: actual burglary rises from about 2% to 2.5%, rather than 3%, and actual violent crime rises slightly from about 3% to 3.5%, rather than remaining stable. Also, car crime is not the highest perceived category in 2010/11: it is highest, but the overview could more clearly note that actual rates change little overall. More exact comparisons would strengthen the report.
Coherence and Cohesion: Band 7.0
The response is organised effectively into an introduction, an overview and two body paragraphs. The progression from burglary and violent crime to car crime is easy to follow, and signposts such as “To begin with” and “Turning to the remaining data” help guide the reader. Comparisons are generally placed together, making the two years straightforward to track. Cohesion is occasionally a little mechanical, with repeated patterns such as “Similarly” and “A similar pattern is seen,” and the overview’s contrast between categories could be linked more precisely to the details that follow. To improve further, vary the transitions and use clearer references when comparing the two years, while retaining this logical paragraph structure.
Lexical Resource: Band 6.0
You use an adequate range of chart-reporting vocabulary, including “decline,” “remained stable,” “accounted for” and “approximately,” so the main trends are communicated clearly. However, some word choices and collocations are inaccurate or awkward: “Burglary perceived 15% crime,” “car crime received the highest number of perceived and actual rates,” and “actual crime” do not express the chart’s percentages naturally. There are also spelling errors in “vicim” and “shoed.” Prefer precise phrases such as “the perceived likelihood of burglary was about 15%” and “car crime had the highest figures.” More accurate collocations and careful spelling would make the description more fluent and precise.
Grammatical Range and Accuracy: Band 6.0
You use a mix of simple and complex sentence forms, including clauses with “whereas” and “while,” and most sentences remain understandable. Some grammatical problems persist. For example, “Burglary perceived 15% crime” lacks a suitable subject-and-verb construction for reporting a figure; “for all the three categories” has an unnecessary article; and “the actual crime increased slightly to 3%” would be clearer as “the actual rate increased slightly.” The sentence “Car crime accounted for the highest proportion for perceived and actual crime” also has an awkward grammatical relationship between the measures and the category. Practise framing data consistently with structures such as “the rate for X was…” and “X stood at…”. This will improve accuracy while preserving your range of sentence patterns.
See this exact question answered at other band scores. The same prompt compared across bands.
Browse more IELTS Writing model answers or get your own writing scored by the same AI examiner.