Band 6.0 IELTS Writing Task 1 Model Answer
Overall Band Score: 6.0 · IELTS Summit Mastery · 2026-11-14
IELTS Writing Task 1 question
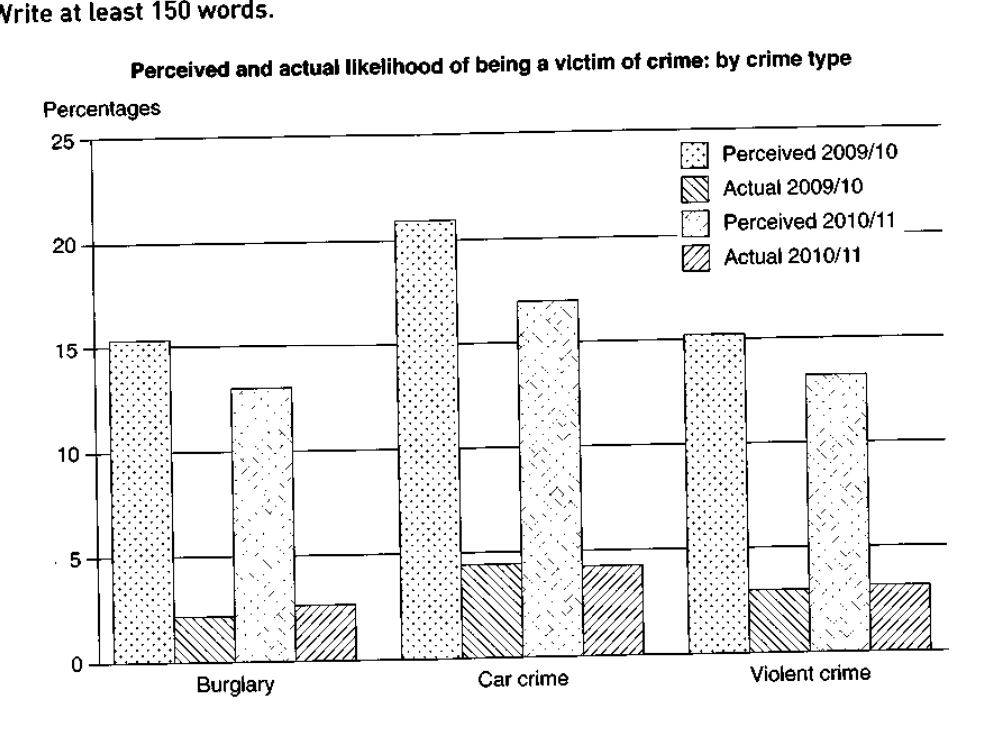
The graph below shows the perceived danger and actual likelihood of being a victim of crime.
Summarise the information by selecting and reporting the main features, and make comparisons where relevant.
Perceived and actual likelihood of being a victim of crime: by crime type
Student answer (Band 6.0)
The bar chart given, illustrates the perceived danger compared to the rate of it actually occuring, being a victim of crime, in 2009,2010 and 2011. The crimes studied in this chart are burglary, car crime and violent crime.
Overall, car crime is the most encountered crime seen in both comparisons, 2009/10 and 2010/1, followed closely by violent crime. burglary however, remain the least to happen, although it does show a rise in 2010/11 in comparison with its 2009/10 record.The ratio of perceived crime is dramaticaly higher than it actually nbeing encountered for all crmies stated.
Car crime was the most perceived crime in 2009/10 with a percentage of 21%, followed by burglary wihich had a close competition with violent crime in terms of statistics.
The perceived crime rate shows a decline in 2010/11 dataset, as the percentage for burglary dropped from15% to 13%, same goes for car crimes ( a drop from 21% to 17%) and violent crimes (15% to 13%).
The actual incidents occuring however, increased in 2010/11 for all crimes mentioned, except for car crimes, as they show a minor downward trend, unlike burglary which rose the most.
AI examiner evaluation
| Criterion | Band |
|---|---|
| Task Achievement / Task Response | 6.5 |
| Coherence and Cohesion | 6.5 |
| Lexical Resource | 5.5 |
| Grammatical Range and Accuracy | 5.5 |
| Overall | 6.0 |
Task Achievement / Task Response: Band 6.5
You identify the chart’s subject and provide an overview of the main contrasts: perceived likelihood is much higher than actual incidence, and perceived figures decline across the periods. You also report several relevant values, including car crime at 21% and its later perceived figure of 17%. However, some details are inaccurate or unclear. The overview says car crime is the most “encountered” crime, although the chart shows it is the most perceived; actual car crime is highest, but only narrowly. You also say violent crime follows burglary closely, when the perceived figures are similar, and the final comparison incorrectly suggests actual car crime fell: it remained at 4.5%. More precise reporting of the actual figures would make the response more complete.
Coherence and Cohesion: Band 6.5
The response has a clear overall shape: an introduction, an overview, and paragraphs describing perceived and actual figures. This gives the reader a generally coherent route through the information, and contrasts such as “however” help signal changes. Some progression and referencing are less clear, though. The overview combines crime frequency with perceived danger, making “most encountered crime” ambiguous, and the final sentence does not specify the actual percentages behind its comparison. The phrase “followed closely by violent crime” also conflicts with the earlier comparison of burglary and violent crime. Grouping the two years consistently—first perceived figures, then actual figures—and using explicit references such as “the perceived rate for burglary” would improve clarity and cohesion.
Lexical Resource: Band 5.5
You use a reasonable range of task-related vocabulary, including “perceived,” “percentage,” “decline,” and “downward trend,” so the main topic is usually understandable. However, several word choices and collocations are imprecise or awkward: “rate of it actually occuring,” “most encountered crime,” and “actual incidents occuring” do not describe the chart’s likelihood figures naturally. There are also noticeable spelling errors, including “dramaticaly,” “crmies,” and “wihich,” as well as inconsistent forms such as “car crimes.” These slips reduce precision and polish. Prefer standard chart language such as “actual likelihood,” “recorded incidence,” and “the figure for car crime,” and check spelling and word forms carefully.
Grammatical Range and Accuracy: Band 5.5
You attempt a mix of simple and more complex sentences, including a contrast introduced by “although” and a comparison using “as.” Meaning is generally recoverable, but some grammatical errors and punctuation problems remain. For example, “burglary however, remain” has a subject–verb agreement error, while “The bar chart given, illustrates” uses an unnecessary comma between the subject and verb. The opening phrase “in 2009,2010 and 2011” is also not clearly expressed as the two periods shown. In “the percentage for burglary dropped from15% to 13%, same goes for car crimes,” the second clause is not grammatically complete. Use complete clauses, consistent tense, and careful punctuation; for example, “The perceived figure for burglary fell from about 15.5% to 13%, and the same pattern occurred for car crime.”
See this exact question answered at other band scores. The same prompt compared across bands.
Browse more IELTS Writing model answers or get your own writing scored by the same AI examiner.