Band 4.5 IELTS Writing Task 1 Model Answer
Overall Band Score: 4.5 · IELTS Summit Mastery · 2026-11-14
IELTS Writing Task 1 question
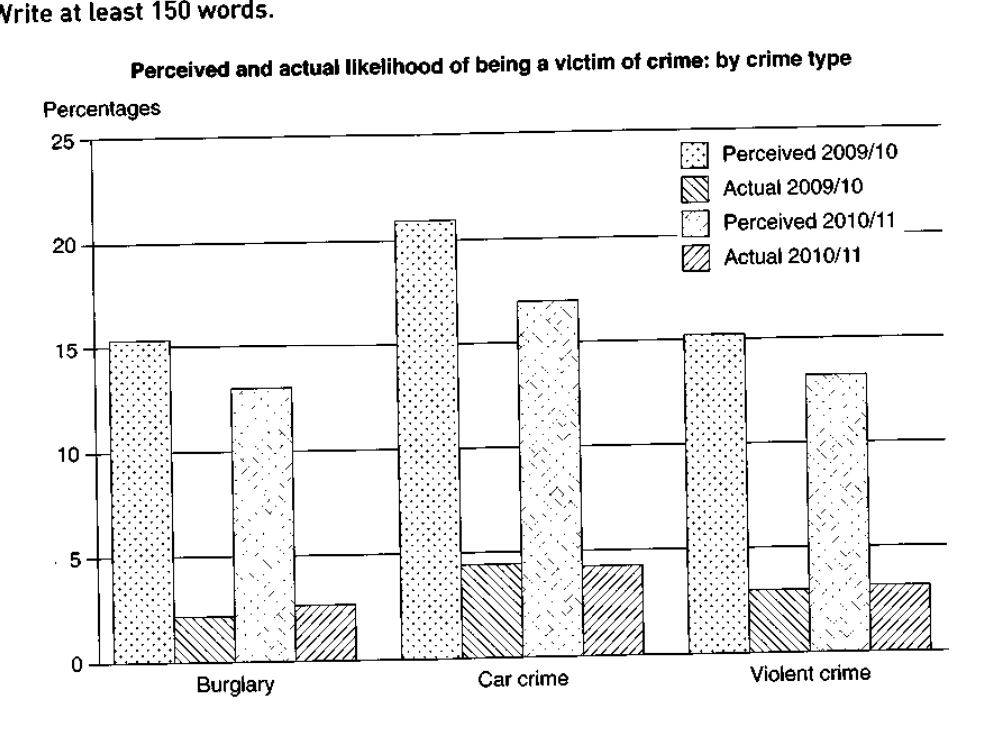
The graph below shows the perceived danger and actual likelihood of being a victim of crime.
Summarise the information by selecting and reporting the main features, and make comparisons where relevant.
Perceived and actual likelihood of being a victim of crime: by crime type
Student answer (Band 4.5)
The bar chart compares the percentage of perceived danger and actual likelihood of being a victim of crime.
overall, the highest percentage was car crime Through the perceived 2009/10, while the lowest figure was burglary actual 2010/11 during the period.
Looking at the details, the highest percentage of car crime was recorded a perceived 2009/10 at approximately 22%, while the lowest percentage was recorded a lower than car crime. and 17 % was the perceived in 2010 to 2011,
In addition, burglary recorded a considerably perceived 2009/10 at approximately 15%.Similarly, perceived 2010/11 closely 13 % in the same Crime. Furthermore, actual was the percentage of lowest at approximately 2% and
AI examiner evaluation
| Criterion | Band |
|---|---|
| Task Achievement / Task Response | 3.5 |
| Coherence and Cohesion | 4.5 |
| Lexical Resource | 5.5 |
| Grammatical Range and Accuracy | 4.5 |
| Overall | 4.5 |
Task Achievement / Task Response: Band 3.5
You identify the chart’s subject and make a relevant comparison, noting that perceived car-crime risk was highest in 2009/10. However, the response is incomplete and does not give a clear overview of the main patterns across all three crime types and both years. It mentions only some perceived figures and one actual figure, omitting most actual-versus-perceived comparisons and the violent-crime data. The statement that burglary actual was the lowest is broadly supported, but the chart shows this at about 2% in 2009/10, not 2010/11. The response is also 99 words, below the required 150; this limits the coverage and development of the summary. Include a concise overview and select key comparisons for every crime type.
Coherence and Cohesion: Band 4.5
There is a basic attempt to organise the response: an opening sentence is followed by an overview and then detail, with signposts such as “Looking at the details” and “In addition.” This gives the reader some sense of the intended progression. However, the sequence is difficult to follow because several sentences are incomplete or abruptly joined, particularly “the lowest percentage was recorded a lower than car crime” and the final clause ending with “and.” Connections between figures are also unclear, so the reader cannot reliably tell which year or series is being compared. Use complete sentences, group the data by crime type or by perceived versus actual likelihood, and make each comparison explicit. Paragraphing and linking should support a clear progression rather than merely introduce points.
Lexical Resource: Band 5.5
The response uses some relevant chart vocabulary, including “percentage,” “approximately,” “recorded,” and “perceived,” and it attempts to describe comparisons with “highest” and “lowest.” This shows a basic range suited to the task. However, several word combinations are inaccurate or unclear, such as “Through the perceived 2009/10,” “a considerably perceived,” and “perceived 2010/11 closely 13%.” “Actual” is also used without a clear noun or explanation in places. These choices make some data descriptions hard to interpret. Aim for precise, natural phrases such as “the perceived likelihood of car crime” and “the actual figure for burglary.” Check that comparative vocabulary describes the relationship between figures, rather than standing in for a complete comparison.
Grammatical Range and Accuracy: Band 4.5
You use a few basic sentence patterns and attempt to vary the organisation with an opening statement and introductory phrases. However, control of sentence structure is inconsistent, and several clauses are incomplete or lack the grammatical links needed to express a full comparison. For example, “the lowest percentage was recorded a lower than car crime” has no clear grammatical construction after “recorded,” while “and 17% was the perceived in 2010 to 2011” is also difficult to parse. Capitalisation and punctuation are inconsistent, including the lowercase “overall” and missing spacing after a full stop. Build each sentence around a clear subject and verb, use complete clauses, and check articles and word order when describing a figure. This will make the information easier to understand.
See this exact question answered at other band scores. The same prompt compared across bands.
Browse more IELTS Writing model answers or get your own writing scored by the same AI examiner.