Band 6.0 IELTS Writing Task 1 Model Answer
Overall Band Score: 6.0 · IELTS Summit Mastery · 2026-11-15
IELTS Writing Task 1 question
The graph below shows the perceived danger and actual likelihood of being a victim of crime.
Summarise the information by selecting and reporting the main features, and make comparisons where relevant.
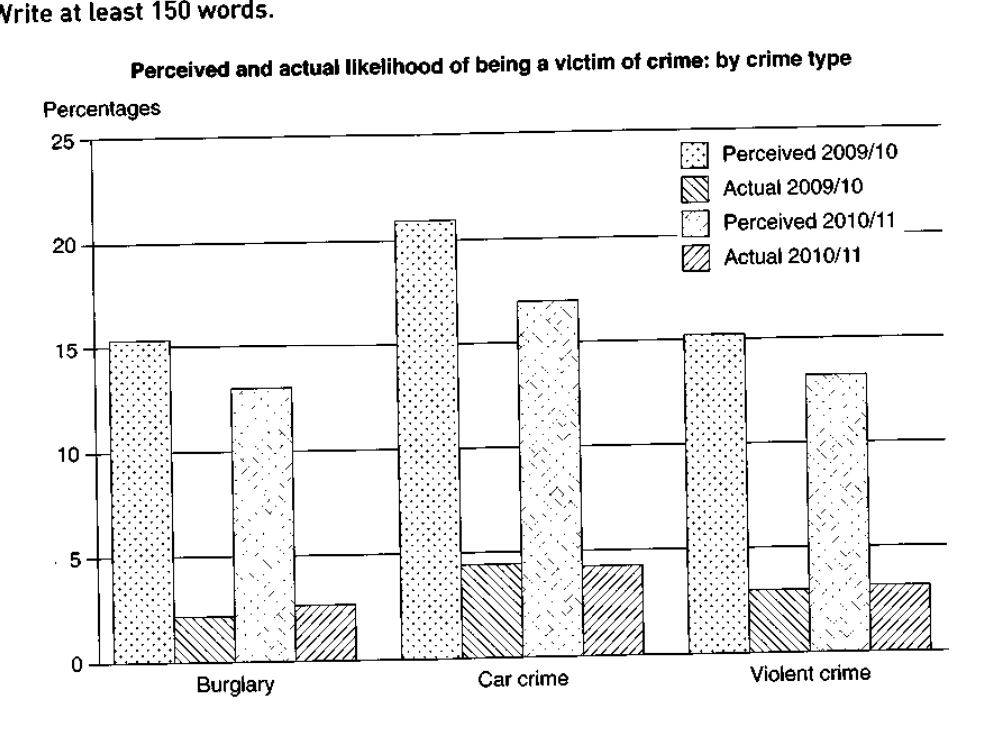
Perceived and actual likelihood of being a victim of crime: by crime type
Student answer (Band 6.0)
The bar chart compares how people perceive crime and actual likelihood of being a victim of, burglary, car crime and violent crime, in 2009 and 2010.
Overall, a large amount of population perceive crime in both years, whereas the actual possibilty if being a victim is far to less. Another common difference is, all three crimes percentage in both likelihood and perceiving decreases in next year.
In 2009/10, car crime has the highest perceive value at lightly over 20 percentage, while the actual crime happening rate is around 4 percentage. Meanwhile, both burglary and violent crime are almost same at 15 percentage, with 2 percentage in likelihood of burglary and 3 percentage in violent crime.
In 2010/11, ranking of crimes is identical as previous year, but slightly lower values in people perceiving all three crimes. Car crime with highest perceive value ar 17 percentage, while actual happening of crime if almost same as previous year. Same with burglary and violet crime, both perceive value at 13 percentage, with likelihood of crime is at 2.5 percentage and 3.5 percentage respectively.
AI examiner evaluation
| Criterion | Band |
|---|---|
| Task Achievement / Task Response | 7.0 |
| Coherence and Cohesion | 6.5 |
| Lexical Resource | 5.5 |
| Grammatical Range and Accuracy | 5.5 |
| Overall | 6.0 |
Task Achievement / Task Response: Band 7.0
You cover the main comparisons and provide a clear overview: perceived risk is much higher than actual victimisation, and perceived figures fall in the later period. The ranking is also accurately identified, with car crime highest in both years. Most figures are close to the chart, including the 2009/10 estimates and the 2010/11 actual rates. However, the overview overgeneralises when it says that percentages for “all three crimes” decrease: actual rates rise slightly for burglary and violent crime, while car crime is unchanged. The later-period perceived figures for burglary and violent crime are also both described as 13%, although the chart shows about 13% and 13.5%. A more precise overview distinguishing perceived from actual trends would strengthen an otherwise well-selected account.
Coherence and Cohesion: Band 6.5
The response has a clear four-paragraph structure: an introduction, an overview, and separate paragraphs for each period. This makes the information easy to follow, and phrases such as “Meanwhile” and “In 2010/11” help signal comparisons and progression. The organisation is effective, but some links are mechanical or awkward, particularly “Another common difference is” and “Same with burglary and violet crime.” The final paragraph also repeats the earlier pattern rather than explicitly contrasting the small changes in actual rates with the fall in perceived risk. To make cohesion more flexible, use clearer referencing and comparison phrases, and connect related figures within sentences without relying on repeated “while” constructions.
Lexical Resource: Band 5.5
You use relevant topic vocabulary, including “perceive,” “actual,” “likelihood,” “ranking,” and “percentage,” so the reader can understand the intended comparisons. However, several word choices and collocations are inaccurate or unnatural, such as “a large amount of population,” “actual crime happening rate,” and “far to less.” There are also spelling errors in “possibilty,” “ar,” and “violet,” and “perceive” is repeatedly used where the adjective “perceived” is needed. These issues make the description less precise and sometimes slow the reader, despite the overall meaning remaining recoverable. Build a more reliable set of chart-description phrases and check spelling and word forms before finishing.
Grammatical Range and Accuracy: Band 5.5
You attempt a mix of simple and more complex sentences, including comparisons with “while” and clauses beginning “whereas.” The main message is generally understandable, but errors in sentence construction and grammatical forms are frequent enough to affect fluency. For example, “people perceive crime” does not fit the intended passive meaning, and “with likelihood of crime is at” combines incompatible structures. The opening also has an unnecessary comma in “victim of, burglary,” while “all three crimes percentage” lacks a clear grammatical relationship between its nouns. Practise forming accurate comparison clauses and use consistent structures such as “the perceived figure was…, while the actual rate was…”. Proofreading for articles, agreement, and sentence boundaries will also help.
See this exact question answered at other band scores. The same prompt compared across bands.
Browse more IELTS Writing model answers or get your own writing scored by the same AI examiner.