Band 5.5 IELTS Writing Task 1 Model Answer
Overall Band Score: 5.5 · IELTS Summit Mastery · 2026-11-15
IELTS Writing Task 1 question
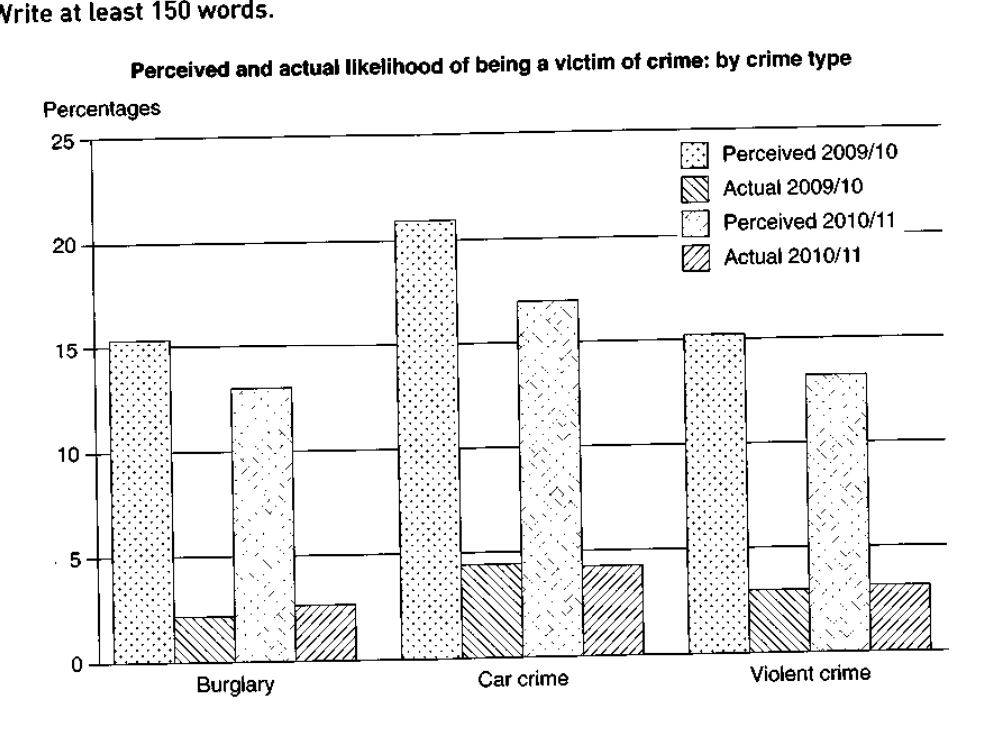
The graph below shows the perceived danger and actual likelihood of being a victim of crime.
Summarise the information by selecting and reporting the main features, and make comparisons where relevant.
Perceived and actual likelihood of being a victim of crime: by crime type
Student answer (Band 5.5)
The bar chart illustrates perceived danger and actual likelihood of bein a victim of crime and compare the percentage between Burglary, Car crime, Violent crime
Overall,The largest proportion was at the car crime the perceived since 2009\2010,while the lowest percentage was violent crime for the actual we had the highest percentage was the car crime and the smallest percentage was the burglary
Regarding in 2009 and 2010 the largest proportion was the car crime in the perceived and actuall , the perceived accounted for around 22% while actual made up 3% , second ranked at perceived was burglary constituted around 16% followed by violent crime by 15% , the actual in the second we had Violent crime accounted for 3% and the lowest percentage 2% in burglary
in 2010 and 2011 the largest between this two danger car crime in the first with 16% in perceived and 4% in actual, followed by violent crime and the smallest proportion wad burglary contributed 13% at perceived and around 2% in actual
AI examiner evaluation
| Criterion | Band |
|---|---|
| Task Achievement / Task Response | 5.5 |
| Coherence and Cohesion | 5.5 |
| Lexical Resource | 5.5 |
| Grammatical Range and Accuracy | 5.0 |
| Overall | 5.5 |
Task Achievement / Task Response: Band 5.5
You identify the chart’s main comparison: perceived risk is much higher than actual victimisation for all three crimes, and car crime is generally highest. You also include figures for both periods, such as about 22% perceived risk for car crime in 2009/10 and around 2% actual burglary. However, the overview is unclear and partly inaccurate: violent crime is not the lowest perceived figure in 2009/10, as burglary and violent crime are both about 15.5%. The account also omits the broad pattern that perceived figures fell in 2010/11 while actual figures rose slightly or stayed similar. Some comparisons are incomplete, so the key features are only partly covered. State the overall trends clearly, then support them with accurate, selective comparisons.
Coherence and Cohesion: Band 5.5
The response has a basic structure, moving from an introduction and overview to separate discussion of the two periods. This gives the reader some sense of how the information is organised. However, progression within paragraphs is often difficult to follow: the overview combines several rankings in one long sentence, and phrases such as “the actual in the second” do not clearly identify the comparison. Linking words including “followed by” and “while” are used, but relationships between figures are sometimes unclear or repetitive. Paragraphing and punctuation also do little to separate the main trends from supporting details. Organise the report around a clear overview followed by two concise comparison paragraphs, and use explicit references such as “by contrast” or “in the following year” where they clarify the relationship.
Lexical Resource: Band 5.5
You use some relevant chart vocabulary, including “percentage,” “accounted for,” “constituted,” and “followed by,” and the reader can generally recognise the crime categories and comparisons. However, the range is limited and several expressions are unnatural or imprecise, such as “the largest proportion was at the car crime” and “the largest between this two danger.” Repetition of “largest proportion,” “percentage,” and “smallest” also makes the report less precise. There are spelling errors, including “bein,” “actuall,” and “wad,” which reduce accuracy. Aim for natural collocations used to describe data, such as “the perceived risk of car crime was highest,” and vary your language with terms such as “figure,” “rate,” and “stood at.”
Grammatical Range and Accuracy: Band 5.0
The response attempts longer sentences and comparisons, for example, “the perceived accounted for around 22% while actual made up 3%,” but control is inconsistent. Several sentences lack clear grammatical structure or necessary articles, as in “the largest proportion was at the car crime,” while “the actual in the second we had Violent crime” is difficult to parse. Tense and sentence boundaries are also uneven, and commas are often used where full stops would make the meaning clearer. Most clauses rely on simple patterns, with limited accurate variety. Build shorter, complete sentences first, checking subject–verb structure and articles; then combine related information with controlled clauses, for example, “Perceived risk of car crime stood at about 21% in 2009/10, compared with an actual rate of roughly 4.5%.”
See this exact question answered at other band scores. The same prompt compared across bands.
Browse more IELTS Writing model answers or get your own writing scored by the same AI examiner.