Band 5.0 IELTS Writing Task 1 Model Answer
Overall Band Score: 5.0 · IELTS Summit Mastery · 2026-11-15
IELTS Writing Task 1 question
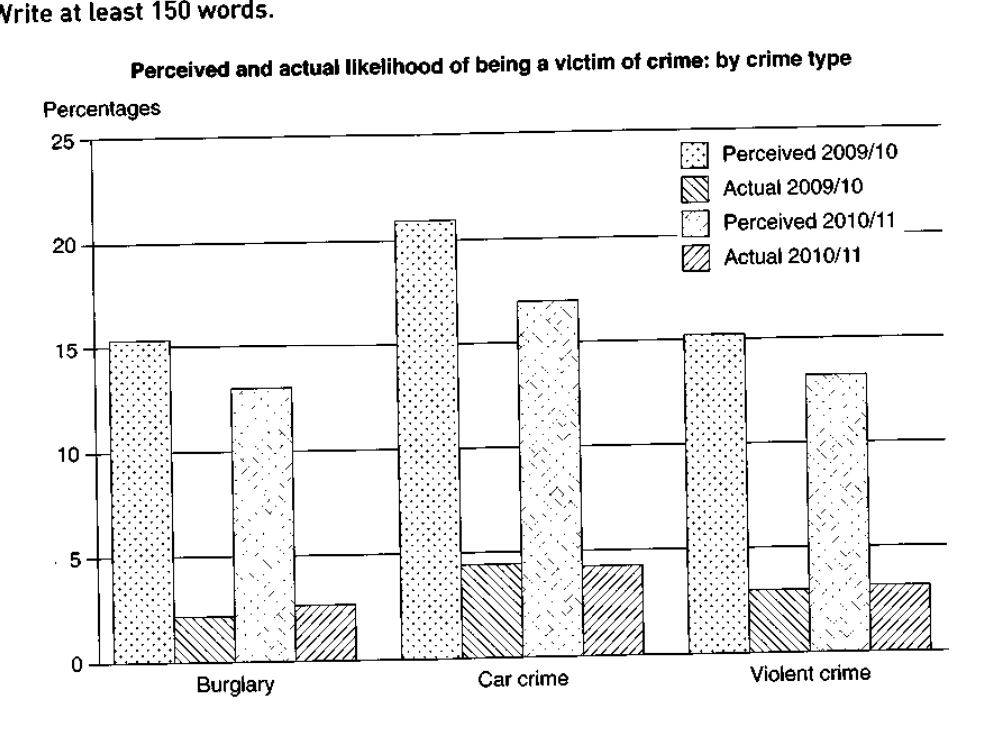
The graph below shows the perceived danger and actual likelihood of being a victim of crime.
Summarise the information by selecting and reporting the main features, and make comparisons where relevant.
Perceived and actual likelihood of being a victim of crime: by crime type
Student answer (Band 5.0)
This graph illustrates the perceived danger and actual likelihood of being a victim of crime. In burglary Perceived 2009/10 increased over 15% and the Actual 2009/10 is fewer about almost half of 5% and the Perceived 2010/11 rises half between 10% and 15% and for the Actual 2010/11 decresed just around 3%. In comparison of Car Crime, Perceived 2009/10 has the highest percentage among all around 20 plus percentage and for the Actual 2009/10 it is just a little below 5% and the Perceived 2010/11 also rises above 15 percentage and for the last one the Actual 2010/11 is a little bit fewer than the Perceived 2010/11. On the other hand the Violent Crime Perceived 2009/11 increase a little higher above 15% and Actual 2009/10 is lower than 5% and the Perceived 2010/11 is lower than 15% while the actual 2010/11 is just lower than 5%. Overall the perceived is the highest among all specially the car crime has the highest percieved. this only means the actualy crime happens rarely.
AI examiner evaluation
| Criterion | Band |
|---|---|
| Task Achievement / Task Response | 5.0 |
| Coherence and Cohesion | 5.0 |
| Lexical Resource | 5.0 |
| Grammatical Range and Accuracy | 5.0 |
| Overall | 5.0 |
Task Achievement / Task Response: Band 5.0
You identify the chart’s central contrast: perceived risk is much higher than actual victimisation, and car crime has the highest perceived figures. You also refer to all three crime types and both years. However, the account is only partly effective because several comparisons are unclear or inaccurate. For example, the 2010/11 burglary perception is about 13%, not a rise, and the actual figure increased slightly from about 2% to 2.5%, rather than decreasing. The statement that actual crime “happens rarely” is also too broad for what the chart measures. Give a concise overview of the main patterns, then report the key changes accurately and distinguish perceived from actual figures.
Coherence and Cohesion: Band 5.0
The response follows a recognisable order, moving from burglary to car crime and then violent crime, and it includes an overall comment at the end. This gives the reader some structure. However, there is no clear paragraphing, and the long sentences combine several figures and comparisons, making the progression difficult to follow. Linking phrases such as “In comparison” and “On the other hand” are used, but they do not always express a clear relationship between the data. The final overview repeats the point that perceived risk is highest rather than synthesising the main trend across both years. Separate the overview from the details and use shorter, clearly organised comparisons.
Lexical Resource: Band 5.0
You use relevant chart vocabulary, including “perceived,” “actual,” “percentage,” and the crime categories, so the topic is generally understandable. However, the range is limited and several word choices or collocations are awkward, such as “increased over 15%,” “fewer than the perceived,” and “the actualy crime happens rarely.” Repetition of “just,” “a little,” and “higher” also makes the description imprecise. Spelling errors such as “decresed” and “percieved” are noticeable. Aim for accurate reporting language such as “stood at,” “was approximately,” “fell slightly,” and “was considerably lower than.” This would make comparisons clearer and more appropriate for an academic chart summary.
Grammatical Range and Accuracy: Band 5.0
You attempt to connect several ideas in longer sentences, but these structures are often difficult to control. For example, “In burglary Perceived 2009/10 increased over 15% and the Actual 2009/10 is fewer…” shifts tense and does not form a clear grammatical comparison. The response also has problems with articles, agreement, and sentence boundaries, as in “the perceived is the highest among all” and the extended car-crime sentence. Most statements rely on similar simple patterns, while attempts to combine clauses often create errors that make the data harder to interpret. Use complete sentences with consistent past-tense reporting verbs, and check that each comparison has a clear subject and grammatical structure.
See this exact question answered at other band scores. The same prompt compared across bands.
Browse more IELTS Writing model answers or get your own writing scored by the same AI examiner.