Band 5.5 IELTS Writing Task 1 Model Answer
Overall Band Score: 5.5 · IELTS Summit Mastery · 2026-11-15
IELTS Writing Task 1 question
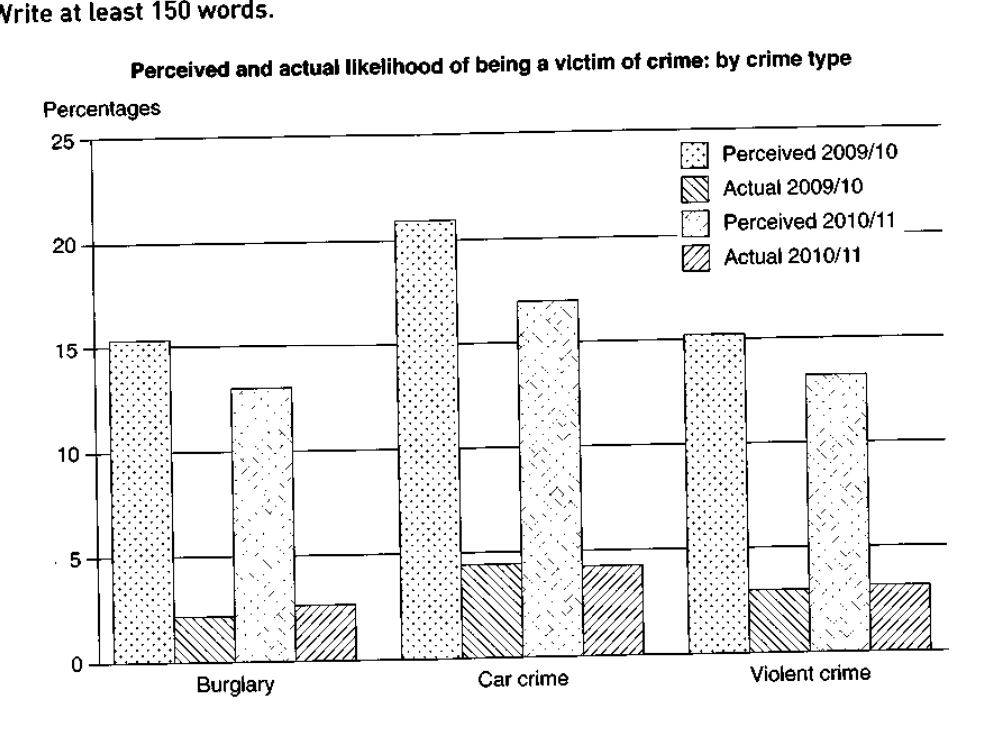
The graph below shows the perceived danger and actual likelihood of being a victim of crime.
Summarise the information by selecting and reporting the main features, and make comparisons where relevant.
Perceived and actual likelihood of being a victim of crime: by crime type
Student answer (Band 5.5)
The bar chart illustrates the comparsion between the perceieved danger and acutal likehood of being a acuse of crime.
Overall, it is evident that crime was classified into the three different categories.The highest category which perceived the danger was car crime in year 2009/10, whereas, the least number of crime perceieved was by burglary in 2010/11.
To begin with Burglary, 15% of crime was perceived in 2009/10 and 13% in 2010/11, while actual crime rate was approx similar in both the year. Athough car crime shows the highest perceived crime in 2009/10 and 2010/11, which were accounted for 21% and 17%. However, actual crime in both years shares the equal percentage which was nearly 4%.
Moreover, the second highest perceived crime was violent crime in 2009/10, at 15%. It was later decreased by 13% in 2010/11. Furthermore, the actual violent crime was stood at 3% in 2009/10, which representa slightly increase in percentage in year 2010/11.
AI examiner evaluation
| Criterion | Band |
|---|---|
| Task Achievement / Task Response | 5.5 |
| Coherence and Cohesion | 6.0 |
| Lexical Resource | 5.5 |
| Grammatical Range and Accuracy | 5.5 |
| Overall | 5.5 |
Task Achievement / Task Response: Band 5.5
You identify the chart’s three crime types and make relevant comparisons between perceived and actual risk across both years. The overview correctly notes that car crime had the highest perceived risk and that perceived figures generally fell. However, some details are inaccurate or unclear: burglary was perceived at about 15.5%, not 15%, in 2009/10, and violent crime fell from about 15.5% to 13.5%, rather than 15% to 13%. The claim that burglary was the least perceived category in 2010/11 is also not quite right, as its figure was slightly below violent crime. Actual rates are described vaguely, and the overview could more clearly highlight the large gap between perceived and actual risk. More precise reporting would strengthen coverage.
Coherence and Cohesion: Band 6.0
The response has a recognisable structure: an introduction, an overview, and paragraphs describing the crime categories. This gives the reader a generally coherent route through the information, and linking phrases such as “To begin with” and “Moreover” help signal progression. However, the organisation is not fully consistent: burglary and car crime are combined in one paragraph, while violent crime is treated separately, and the comparison between perceived and actual figures is not developed systematically. Some connectors are awkward or create unclear relationships, particularly “Although” followed by “However.” Grouping all perceived figures together and then comparing actual rates, or using one paragraph per clear comparison, would make the progression easier to follow. References such as “the highest category” could also be more precise.
Lexical Resource: Band 5.5
You use relevant chart vocabulary, including “perceived,” “actual crime rate,” “percentage,” and “decreased,” so the reader can understand the main subject and comparisons. There is also some attempt to vary expression, for example “accounted for” and “stood at.” However, spelling and word-choice errors are noticeable, including “comparsion,” “perceieved,” “likehood,” and “acuse,” and these reduce accuracy. Some phrases are unnatural or imprecise, such as “the least number of crime perceived” and “shares the equal percentage.” Prefer standard collocations such as “the lowest perceived figure” and “recorded the same proportion.” A more controlled range of accurate terms for describing figures and changes would make the report clearer and more natural.
Grammatical Range and Accuracy: Band 5.5
You attempt a mix of simple and complex sentences, including comparisons with “whereas” and clauses introduced by “which.” The overall meaning is usually recoverable, but some grammatical errors remain. For example, “crime was classified into the three different categories” is an awkward construction, and “actual violent crime was stood at 3%” uses an incorrect verb pattern. In “which representa slightly increase,” the clause and noun phrase are not formed correctly; a clearer version would be “which represented a slight increase.” There are also issues with articles and number agreement in “in both the year.” Sentence boundaries and commas are sometimes awkward, especially around “whereas” and “However.” Review verb patterns, articles, and clause construction while retaining your attempts at complex sentences.
See this exact question answered at other band scores. The same prompt compared across bands.
Browse more IELTS Writing model answers or get your own writing scored by the same AI examiner.