Band 5.5 IELTS Writing Task 1 Model Answer
Overall Band Score: 5.5 · IELTS Summit Mastery · 2026-11-16
IELTS Writing Task 1 question
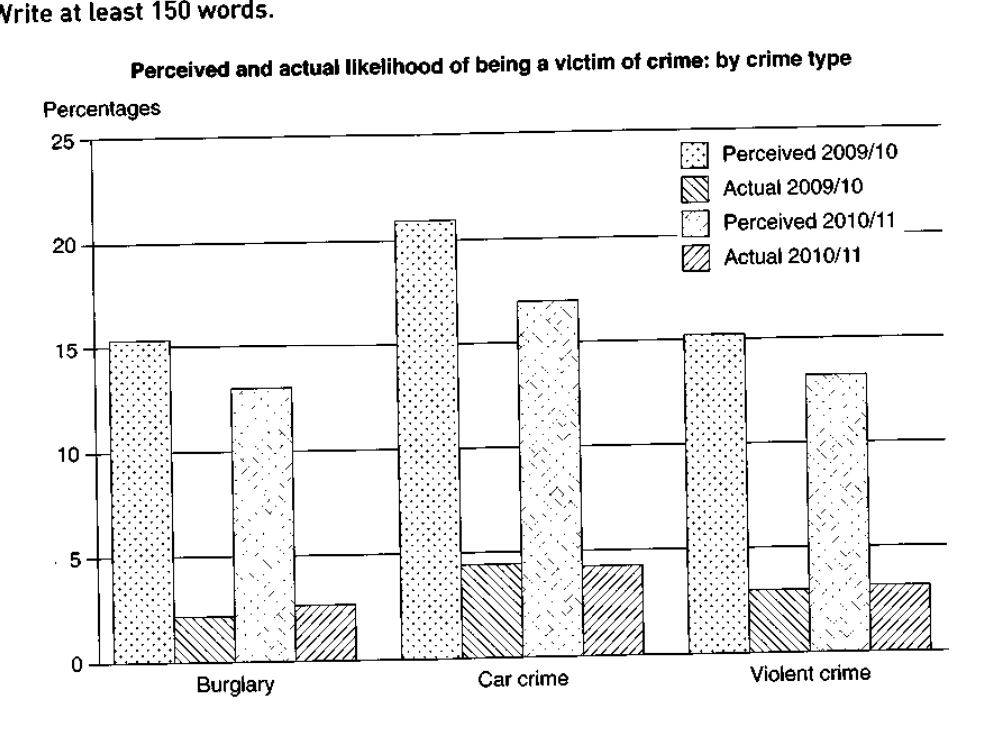
The graph below shows the perceived danger and actual likelihood of being a victim of crime.
Summarise the information by selecting and reporting the main features, and make comparisons where relevant.
Perceived and actual likelihood of being a victim of crime: by crime type
Student answer (Band 5.5)
The following graph illustrates the perceived threat and the actual chances of getting affected by three kinds of the crime; burglary, car crime, and violent crime, in the time span of 2009 and 2011.
Overall, throughout the years, the perception of all three crimes is higher than the actual likelihood of becoming a victim of crime. In the years 2009, 2010 and 2011, the highest percentage of people assume that car crimes will happen more than others but the actual likelihood is dramatically low.
In case of burglary, the perception in the years 2009/2010 is slightly higher, a little more than 15 percent than in the years of 2010/2011 which is between 10 and 15 percent. The actual likelihood is between 0 to 5 percent in all three years. Same is the case with violent crime. It has the almost same perception rate but the actual likelihood is a little different from burglary.
Car crime remains the higher one in both perception and actual likelihood. In the years 2009/2010 more than 20 percent people perceived it while the actual rate was near 5 percent.
AI examiner evaluation
| Criterion | Band |
|---|---|
| Task Achievement / Task Response | 5.5 |
| Coherence and Cohesion | 5.5 |
| Lexical Resource | 6.0 |
| Grammatical Range and Accuracy | 5.5 |
| Overall | 5.5 |
Task Achievement / Task Response: Band 5.5
You identify the main contrast accurately: perceived risk is much higher than actual victimisation for all three crime types, and car crime has the highest perceived figure. You also report the broad decline in perceived burglary and car crime between the two periods. However, the overview refers to “2009, 2010 and 2011,” although the chart compares only 2009/10 with 2010/11, and the response does not clearly summarise the changes in actual figures across those periods. The final paragraph gives car-crime figures only for 2009/10, leaving the second period unreported. Some comparisons are also vague, such as saying violent crime’s actual rate is “a little different” from burglary. Select the key changes and compare both periods more precisely.
Coherence and Cohesion: Band 5.5
The response has a recognisable structure: an introduction, an overview, and paragraphs covering burglary and violent crime before car crime. This helps the reader follow the broad comparison. However, progression is limited because the final paragraph stops after describing car crime in 2009/10, rather than completing the comparison with 2010/11. Some linking is mechanical, particularly “In case of burglary” and “Same is the case with violent crime,” and the reference in “It has the almost same perception rate” is not fully clear. Grouping the figures by period or comparing all three crime types systematically would create a clearer progression. Use linking phrases to show specific contrasts and changes, rather than relying on repeated sentence openings.
Lexical Resource: Band 6.0
You use an adequate range to describe the chart, including “perceived,” “actual likelihood,” “percentage,” and “dramatically low.” These terms generally make the intended comparisons understandable. Some choices are imprecise or unnatural for this task: “getting affected” is not a natural way to describe being a crime victim, and “the higher one” is vague. “The perception of all three crimes” would be clearer as a reference to perceived likelihood, while “people assume” is less suitable than a neutral reporting verb such as “believe” or “expect.” Aim for precise chart language and natural collocations. For example, use “risk of becoming a victim” and “the highest perceived likelihood” to describe the data more accurately.
Grammatical Range and Accuracy: Band 5.5
You attempt both simple and more complex sentence forms, and the overall meaning is usually clear. However, some grammatical errors and awkward constructions remain. In the opening, “three kinds of the crime” has an unnecessary article, and “in the time span of 2009 and 2011” does not express the chart’s two periods accurately. The sentence “In the years 2009, 2010 and 2011, the highest percentage of people assume” has an inconsistent time reference and verb form. There are also problems with number and sentence construction in “more than 20 percent people perceived it.” Review articles, plural forms, and tense consistency, and build comparisons in complete, controlled sentences.
See this exact question answered at other band scores. The same prompt compared across bands.
Browse more IELTS Writing model answers or get your own writing scored by the same AI examiner.