Band 6.0 IELTS Writing Task 1 Model Answer
Overall Band Score: 6.0 · IELTS Summit Mastery · 2026-11-16
IELTS Writing Task 1 question
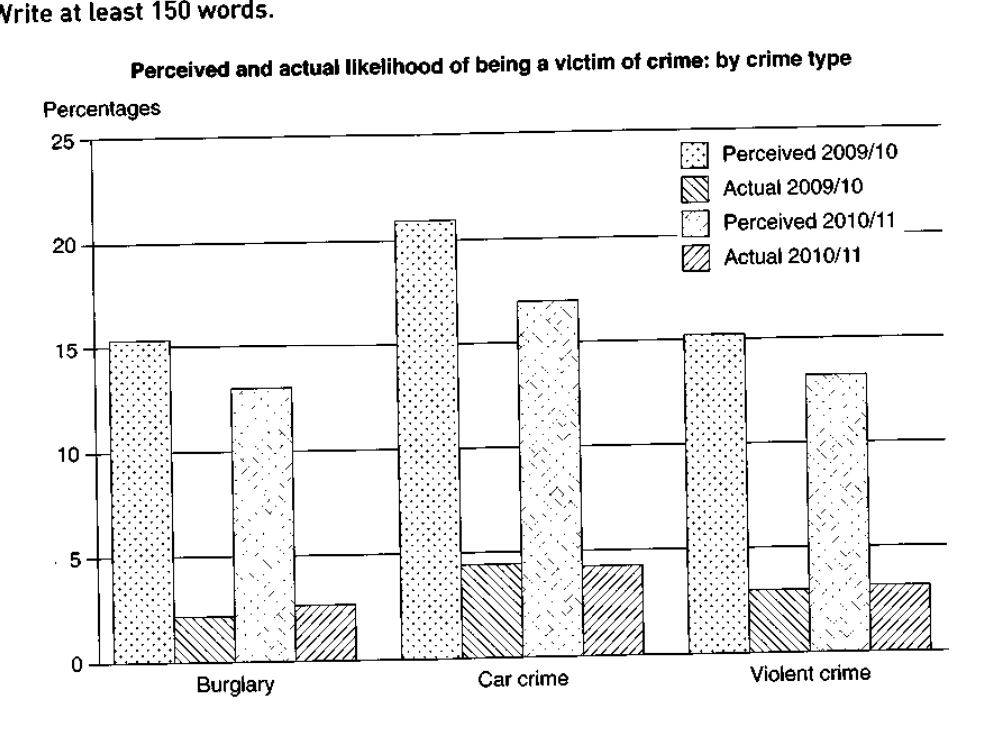
The graph below shows the perceived danger and actual likelihood of being a victim of crime.
Summarise the information by selecting and reporting the main features, and make comparisons where relevant.
Perceived and actual likelihood of being a victim of crime: by crime type
Student answer (Band 6.0)
The bar graph compares how dangerous people believe different crimes to be, with the actual likelihood of becoming a victim of them.
Overall, people had a high vision of becoming a victim of different crimes. Perceived rate of crimes were significantly higher than the actual crime happened in the timeline [redacted phone]. Car related crime was the most perceived danger in those years.
In 2009/10, nearly 21% of people perceived car crime as the most dangerous one and likely to happen but the actual rates were significantly lower which was below 5%. This is the similar case in 2010/11 with 16% perception and the same actual crime rate below 5%.
In the entire timeline, burglary and violent crimes showed the identical rate of perception with 15%. The actual rates of burglary was approximately 2% in 2009/10 and 3% in 2010/11. While original rate of violent crimes were around 3% in all years.
AI examiner evaluation
| Criterion | Band |
|---|---|
| Task Achievement / Task Response | 6.5 |
| Coherence and Cohesion | 6.5 |
| Lexical Resource | 6.0 |
| Grammatical Range and Accuracy | 5.5 |
| Overall | 6.0 |
Task Achievement / Task Response: Band 6.5
You identify the chart’s central contrast: perceived risk is much higher than actual victimisation, and car crime has the highest perceived figure in both periods. The comparisons for car crime are relevant, and you include approximate actual rates for burglary and violent crime. This covers the main task features, but some details are incomplete or imprecise. For example, you describe burglary and violent-crime perceptions as identical at 15% throughout, whereas they differ slightly and change between periods; the chart shows about 15.5% and 13% for burglary, and 15.5% and 13.5% for violent crime. The overview also misses the broad decline in perceived risk from 2009/10 to 2010/11. A more precise overview and fuller reporting of the changes would strengthen the response.
Coherence and Cohesion: Band 6.5
The response has a clear overall arrangement: an introduction, an overview, and two paragraphs of supporting comparisons. The progression from the general pattern to car crime and then the other categories is easy to follow, and phrases such as “In 2009/10” help orient the reader. However, some linking and reference choices are awkward or unclear. “This is the similar case” does not connect the comparison naturally, while “In the entire timeline” is an imprecise transition. The final paragraph also combines several figures without clearly distinguishing the two periods, which makes the comparison harder to track. Use more direct links such as “Similarly” and organise the figures by year or crime type to make the progression more controlled.
Lexical Resource: Band 6.0
You use a reasonable range of topic vocabulary, including “perceived,” “actual likelihood,” “victim,” and “rates,” and the meaning is generally clear. There are also attempts at more formal phrasing, such as “significantly lower.” However, several word choices and collocations are inaccurate or unnatural: “a high vision of becoming a victim” does not express perceived risk, and “the actual crime happened” is not an appropriate way to describe the chart’s figures. “Original rate” is also unclear in this context. These choices limit precision even though they do not prevent the reader from understanding the main comparisons. Aim for standard chart language and use “risk,” “proportion,” or “actual victimisation” consistently.
Grammatical Range and Accuracy: Band 5.5
You attempt a mix of sentence forms, including a complex comparison with “although” implied by “but” and a sentence beginning “While.” Most of the message remains understandable, but some grammatical errors recur. For example, “Perceived rate of crimes were” has a singular/plural agreement problem, and “The actual rates of burglary was” also mismatches subject and verb. The sentence beginning “While original rate…” is a fragment, and “in all years” does not fit the two-period comparison cleanly. Articles and plural forms also need closer control. Build accuracy by checking subject–verb agreement and ensuring that subordinate clauses such as “While…” are joined to a complete main clause.
See this exact question answered at other band scores. The same prompt compared across bands.
Browse more IELTS Writing model answers or get your own writing scored by the same AI examiner.