Band 5.5 IELTS Writing Task 1 Model Answer
Overall Band Score: 5.5 · IELTS Summit Mastery · 2026-11-17
IELTS Writing Task 1 question
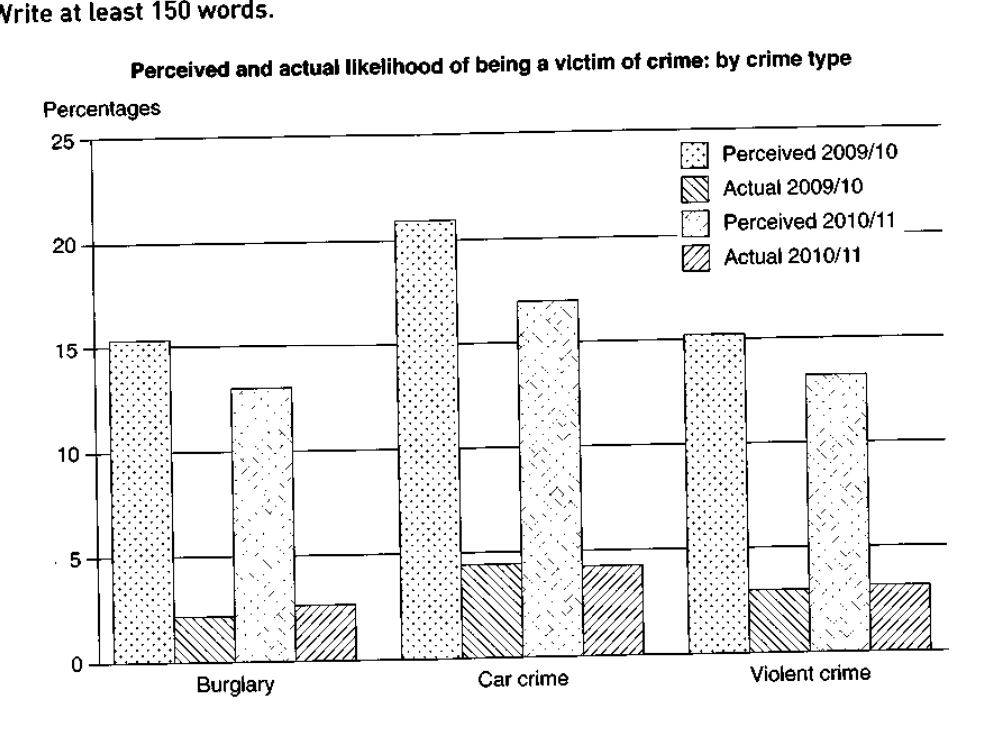
The graph below shows the perceived danger and actual likelihood of being a victim of crime.
Summarise the information by selecting and reporting the main features, and make comparisons where relevant.
Perceived and actual likelihood of being a victim of crime: by crime type
Student answer (Band 5.5)
The bar chart illustrates what is the percentage of recognized and actual crime victim by crime type.
Overall, Car crime is the major one in perceived crime and genuine crime from 2009/10 as well as 2010/11. Burglary was second in perceived from 2009/10. But from 2010/11, Violent crime took second place regarded as crime. And in real crime violent crime was second from 2009/10 and 2010/11.
On the first hand, Car crime was first with highest crime rate which were viewed as a crime in 2009/10 and 2010/11. On the other side, it's true crime rate was also maximum compared to other two. Second place was took by burglary from 2009/10 but from 2010/11 it replaced by violent crime considered as a crime.
On the other hand, in actual crime car crime considered as a top crime rate in both 2009/10 and 2010/11. for second place picture is different violent crime was the one who captured this position for all years. Burglary was the last one on the list for both 2009/10 and 2010/11.
AI examiner evaluation
| Criterion | Band |
|---|---|
| Task Achievement / Task Response | 5.5 |
| Coherence and Cohesion | 5.5 |
| Lexical Resource | 5.0 |
| Grammatical Range and Accuracy | 5.0 |
| Overall | 5.5 |
Task Achievement / Task Response: Band 5.5
You identify the main broad pattern: car crime has the highest perceived and actual figures, while burglary is lowest for actual crime. However, several comparisons are inaccurate or unclear. In perceived crime, burglary and violent crime are tied at about 15.5% in 2009/10, and violent crime is second in 2010/11; your account says burglary was second in the first year without noting the tie. More importantly, actual crime is not described with enough numerical detail, and the claim that violent crime was second in both years overlooks that burglary and violent crime are distinct but close in actual figures. Include approximate percentages and clearly compare the changes between years to make the key features more fully supported.
Coherence and Cohesion: Band 5.5
The response has an identifiable introduction, overview and two body paragraphs, and it groups perceived crime separately from actual crime. However, progression is limited because the same ranking is repeated several times: car crime is called the highest in both body paragraphs, and the second-place pattern is restated rather than developed with figures or changes. Linking phrases such as “On the first hand,” “On the other side,” and “On the other hand” are repetitive or do not clearly express the relationships between points. Organise the details into a clearer comparison of perceived versus actual rates, then highlight how each changed across the two periods. This would make the sequence more purposeful and reduce repetition.
Lexical Resource: Band 5.0
You use some relevant terms, including “perceived,” “actual,” “crime rate,” and “second place,” so the topic is generally understandable. However, vocabulary is limited and several choices are unnatural or imprecise, such as “recognized crime,” “genuine crime,” “real crime,” and “captured this position.” These alternatives do not consistently distinguish perceived likelihood from recorded actual likelihood. Phrases such as “the major one” and “the last one on the list” are also informal or vague for an academic chart summary. Use a smaller, consistent set of precise terms—for example, “perceived likelihood,” “actual rate,” “highest,” and “lowest”—and choose natural collocations such as “ranked second” or “accounted for.”
Grammatical Range and Accuracy: Band 5.0
The response communicates its general comparisons, but grammatical control is uneven and sentence structures are mostly simple, with attempts at longer constructions that are often faulty. For example, “illustrates what is the percentage” has an incorrect embedded question structure, while “which were viewed as a crime” has unclear agreement and reference. The phrase “Second place was took by burglary” uses an incorrect verb form, and “for second place picture is different” is missing grammatical elements. Capitalisation is also inconsistent, as in “for” after a full stop. Practise accurate comparative sentences and past-tense reporting, such as “Car crime had the highest perceived rate in both periods,” before adding more complex clauses.
See this exact question answered at other band scores. The same prompt compared across bands.
Browse more IELTS Writing model answers or get your own writing scored by the same AI examiner.