Band 5.5 IELTS Writing Task 1 Model Answer
Overall Band Score: 5.5 · IELTS Summit Mastery · 2026-11-18
IELTS Writing Task 1 question
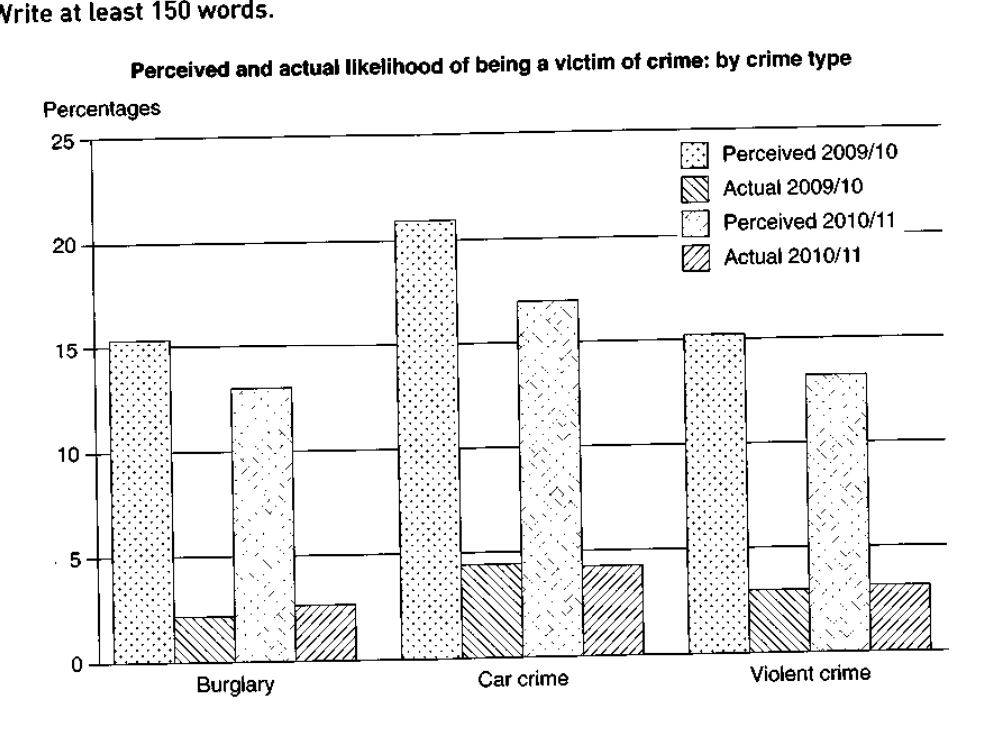
The graph below shows the perceived danger and actual likelihood of being a victim of crime.
Summarise the information by selecting and reporting the main features, and make comparisons where relevant.
Perceived and actual likelihood of being a victim of crime: by crime type
Student answer (Band 5.5)
The bar graph depicts the percentage of predicted and actual crime rate in year 2009 to 10 and 2010 to 11 which is under 3 categories burglary, car crime and violent crime.
Car crimes are the one which have the highest percentage of predicted crime rate. Burglary also has high percentage in prediction but the actual crimes committed are low.
Maximum crimes that are actually happening are related to car , in the year 2009 and 10 it was around 4 percent and was predicted to be around 22 percent, moreover it was predicted to be lower in the year 2010 to 11 whereas it reduced very slightly. On the other hand burglary was predicted to be on the lower side wich was around 13 percent but it slightly increased in the year 2010 to 11. Furthermore, violent crimes were analysed to be around 16 percent in year 2009 and lowered to 13 percent but the actual crimes did not reduce which was around 4 percent for both the respective years.
AI examiner evaluation
| Criterion | Band |
|---|---|
| Task Achievement / Task Response | 5.5 |
| Coherence and Cohesion | 5.0 |
| Lexical Resource | 5.5 |
| Grammatical Range and Accuracy | 5.5 |
| Overall | 5.5 |
Task Achievement / Task Response: Band 5.5
You identify the chart’s three crime types and make relevant comparisons, including that car crime has the highest perceived likelihood and that actual figures are much lower. You also report several trends, such as perceived car crime falling and actual car crime changing very little. However, the overview is not clearly separated or fully developed, and some figures or trends are inaccurate: burglary perception fell from about 15.5% to 13%, rather than increasing, while violent-crime perception fell from about 15.5% to 13.5%. The response also omits a clear comparison of the overall gap between perceived and actual likelihood across all categories. More accurate reporting and a concise overview of the main patterns would make the summary more complete.
Coherence and Cohesion: Band 5.0
The response has a basic sequence: it introduces the chart, identifies the highest perceived category, and then discusses individual crime types. Linking expressions such as “moreover,” “On the other hand,” and “Furthermore” help signal relationships between points. However, the ideas are grouped into only two paragraphs, and the second paragraph moves between car crime, burglary, and violent crime without a consistent comparison pattern. Some links are also unclear; for example, “whereas it reduced very slightly” does not make clear whether this refers to perceived or actual car crime. Organise the body by comparing perceived and actual figures for each crime type, or by contrasting the two years, and use clearer references to improve progression.
Lexical Resource: Band 5.5
You use relevant vocabulary for describing the chart, including “percentage,” “predicted,” “actual,” “highest,” and “reduced.” This gives you enough language to communicate the main subject, but some choices are imprecise or repetitive. “Predicted crime rate” is not quite the same as perceived likelihood, and “crimes that are actually happening” is an awkward way to describe the actual likelihood shown. Phrases such as “on the lower side” and “high percentage in prediction” are also vague or unnatural. Aim for precise chart language and vary expressions for increases, decreases, and comparisons. Spelling errors such as “wich” also reduce accuracy, though the intended meaning remains understandable.
Grammatical Range and Accuracy: Band 5.5
You attempt a mixture of simple and more complex sentences, including a contrast introduced by “On the other hand” and a clause beginning “which was around 13 percent.” The main meaning is generally understandable, but sentence control is uneven. The opening sentence lacks a clear grammatical structure (“which is under 3 categories”), and the long sentence about car crime joins several ideas with commas, making the relationships difficult to follow. There are also problems with articles and number agreement, as in “Car crimes are the one,” and inconsistent tense choices when describing chart data. Use shorter, complete sentences for each comparison, check singular and plural forms, and keep the present tense consistent when reporting what the chart shows.
See this exact question answered at other band scores. The same prompt compared across bands.
Browse more IELTS Writing model answers or get your own writing scored by the same AI examiner.