Band 6.0 IELTS Writing Task 1 Model Answer
Overall Band Score: 6.0 · IELTS Summit Mastery · 2026-11-18
IELTS Writing Task 1 question
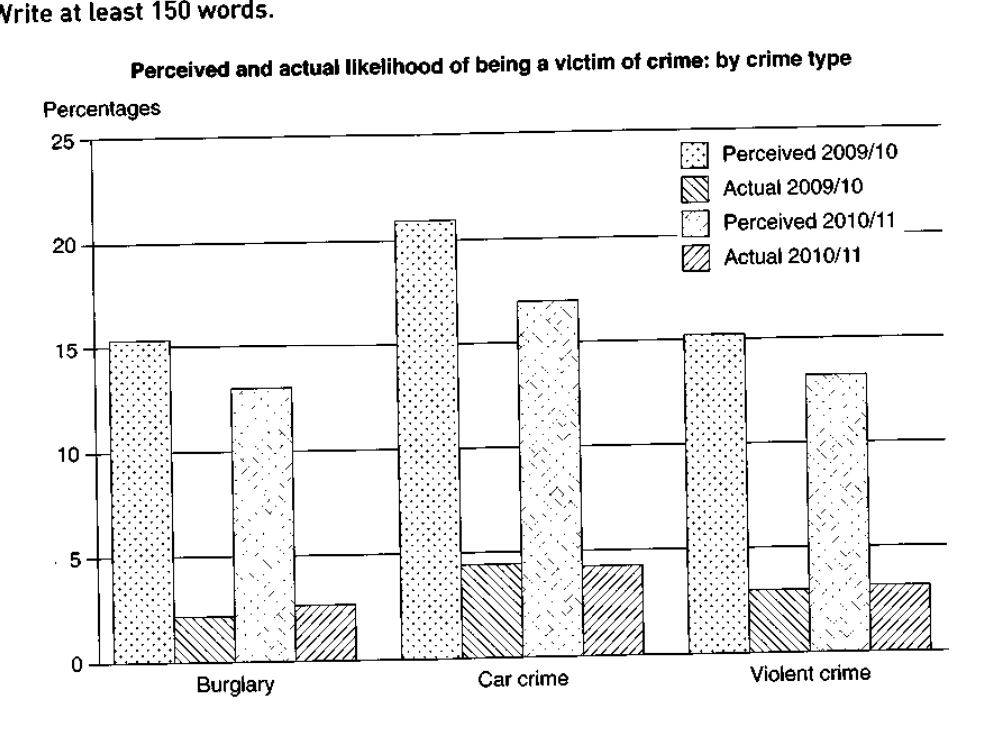
The graph below shows the perceived danger and actual likelihood of being a victim of crime.
Summarise the information by selecting and reporting the main features, and make comparisons where relevant.
Perceived and actual likelihood of being a victim of crime: by crime type
Student answer (Band 6.0)
The graph illustrates the perceived and actual likelihood of being a victim of crime by crime types.The graph is divided into three types of crime, burglary, car crimes and violent crimes.
Overall, we can see that the perceived crimes are alot more than the actual crimes.Burglary is at the bottom in the actual crimes, while the car crimes held the highest place in preceived crimes.
Firstly,percentage of the perceived crimes in burglary is approximately 16%, while the actual amount is only 2%.In 2010-11 the percieved percentage fell to 13% and the actual amount rose to 3%.Perceived car crimes are 21% securing the highest place. In contrast, actual crime was only 4%.The same amount declined to 17%, while the actual amount remained constant.
In violent crimes, the percieved amount was interestingly normal to a percentage of only 15% and actual amount 5 times less than the perceived consisting of only 3%.This amount later fell to 13% and the actual amount remained constant summing upto only 3%.
AI examiner evaluation
| Criterion | Band |
|---|---|
| Task Achievement / Task Response | 6.0 |
| Coherence and Cohesion | 6.0 |
| Lexical Resource | 5.5 |
| Grammatical Range and Accuracy | 5.5 |
| Overall | 6.0 |
Task Achievement / Task Response: Band 6.0
You identify the chart’s central contrast: perceived risk is much higher than actual victimisation, and car crime has the highest perceived figure. You also include several relevant comparisons, such as burglary at about 16% perceived versus 2% actual in 2009/10. However, some details are inaccurate or unclear: actual burglary rises to about 2.5% in 2010/11, not 3%; violent crime’s actual figure rises from 3% to 3.5%, rather than remaining constant; and the later perceived car-crime figure falls to 17%, not an amount that “declined” without a clear subject. The overview is useful but could summarise the broad year-to-year pattern more precisely, including that perceived figures fall across all three categories while actual figures edge up or stay level.
Coherence and Cohesion: Band 6.0
The response has a recognisable structure: an introduction, an overview, and paragraphs describing the crime categories. This gives the reader a coherent overall route through the information, and phrases such as “Overall” and “In contrast” help signal relationships. However, the organisation is not consistently clear. The final paragraph combines both years without clearly distinguishing the 2009/10 and 2010/11 figures, while “This amount later fell” and “the same amount” have uncertain references. The category-by-category approach is workable, but grouping the figures by year or using explicit time markers in each comparison would make progression easier to follow. Some linking is also mechanical, particularly the repeated use of “amount.”
Lexical Resource: Band 5.5
You use enough topic vocabulary to communicate the main comparisons, including “perceived,” “actual,” “percentage,” and “in contrast.” There are also attempts at more descriptive phrasing, such as “securing the highest place.” However, several choices are unnatural or imprecise for chart reporting: “perceived crimes” refers to crimes rather than perceived likelihood, “held the highest place” is awkward, and “interesting normal” does not convey a clear meaning. “Amount” is also repeated where “figure,” “rate,” or “proportion” would be more suitable. Spelling errors such as “preceived” and “percieved” further reduce accuracy. More precise collocations and consistent terminology would make the account clearer and more formal.
Grammatical Range and Accuracy: Band 5.5
You use a mixture of simple statements and longer comparative sentences, and most of the intended meaning can be understood. Some grammatical errors remain, especially in sentence boundaries and sentence construction. For example, “The graph illustrates … crime types.The graph is divided” needs a space after the full stop, and “Firstly,percentage” also lacks spacing after punctuation. The sentence “In 2010-11 the percieved percentage fell to 13% and the actual amount rose to 3%” is understandable, but its figures and comparison would be clearer with parallel phrasing. There are also inconsistent plural forms and article use, as in “the perceived crimes” and “car crimes.” Aim for complete, well-punctuated sentences and use parallel structures when comparing the two years.
See this exact question answered at other band scores. The same prompt compared across bands.
Browse more IELTS Writing model answers or get your own writing scored by the same AI examiner.