Band 5.0 IELTS Writing Task 1 Model Answer
Overall Band Score: 5.0 · IELTS Summit Mastery · 2026-11-18
IELTS Writing Task 1 question
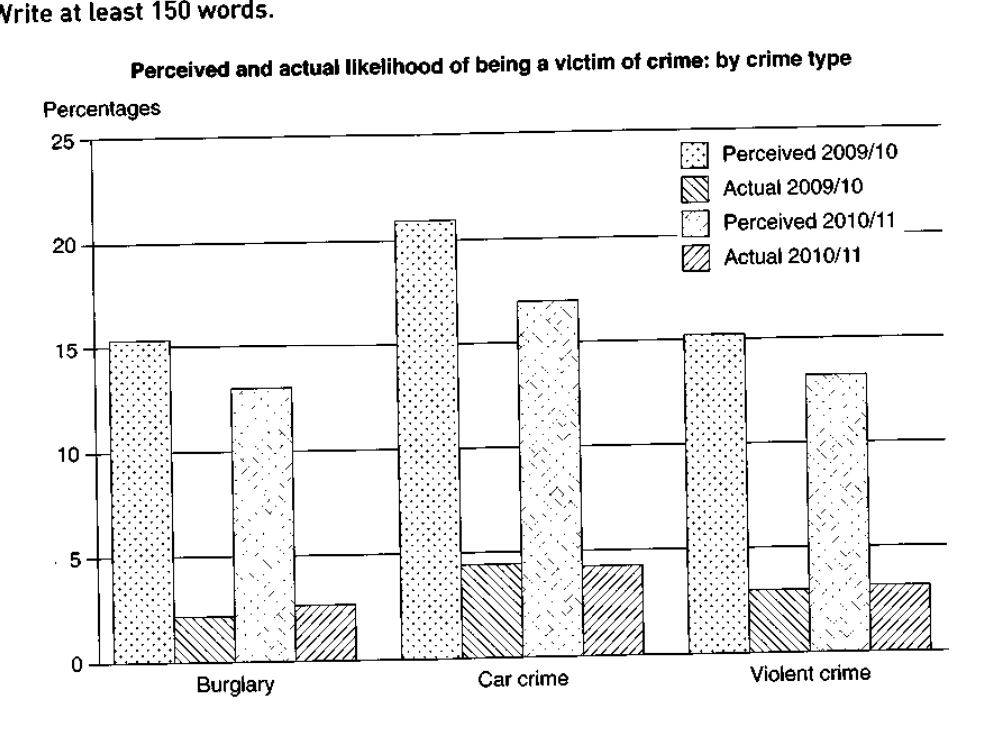
The graph below shows the perceived danger and actual likelihood of being a victim of crime.
Summarise the information by selecting and reporting the main features, and make comparisons where relevant.
Perceived and actual likelihood of being a victim of crime: by crime type
Student answer (Band 5.0)
Crime has always been a nightmare for any society. With the developement in ever field of life the ratio of crimes is also touching the skyline.
The graph shows the relationship between perceived and actual likelihood of being a victim of any crime between the year 2009 to 2011. This graph has mentioned three types of crime. "Burglary", "Car crime" and "Violent crime".
During the 2009/10 season, the likelihood of becoming a victim of car crime was in peak with an almost percentage of 21%. While actual liklihood was less than 5%. The perceived likelihood of being a car crime victim decreased between 2010 and 2011. While thw actual chances of the crime remained same.
There was a slight control over burglary. During 2009/10, the perceived likelihood of being
one of the victims of burglary was almost 15% which reached the percentage of 13% by rhe end of 2011. And the actual likelihood increased during these years as compared to car crime and violent crime.
The violent crime showed the same relation as that of burglary with slight changes. The likelihood of being a victim of violent crime was 3% in 2009/10 and it with little changes kept same in 2010/11.
Concluding this, we can say that during [redacted phone] car crimes had the highest likelihood of happening.
AI examiner evaluation
| Criterion | Band |
|---|---|
| Task Achievement / Task Response | 4.5 |
| Coherence and Cohesion | 4.5 |
| Lexical Resource | 5.0 |
| Grammatical Range and Accuracy | 5.0 |
| Overall | 5.0 |
Task Achievement / Task Response: Band 4.5
You identify the three crime categories and make relevant comparisons, including that car crime has the highest perceived likelihood and that its perceived figure falls from about 21% to 17%. However, the response does not give a clear, accurate overview of the main pattern across both years, and several details are incomplete or misleading. For example, actual burglary rises only slightly, from about 2% to 2.5%, while actual car crime stays around 4.5%; the claim that actual violent-crime likelihood “kept same” overlooks its rise from about 3% to 3.5%. The conclusion that car crimes had the highest likelihood also blurs perceived and actual figures. Focus on the overall gap between perception and reality, then report the key changes precisely.
Coherence and Cohesion: Band 4.5
The response has a basic paragraph structure: an introduction, separate discussion of car crime, burglary and violent crime, and a concluding sentence. This gives the reader some sense of the categories being covered. However, progression is not consistently clear, and the opening comments about crime being a “nightmare” and society’s development do not help organise the chart description. Several sentences begin with “While” as fragments, and links such as “There was a slight control over burglary” do not clearly connect to the data. The final conclusion repeats a broad claim rather than synthesising the comparisons. Use a concise overview after the introduction, group perceived figures separately from actual figures, and use clear links such as “By contrast” to guide comparisons.
Lexical Resource: Band 5.0
You use some task-relevant vocabulary, including “perceived likelihood,” “actual likelihood,” “decreased,” and “increased,” so the reader can generally understand the topic. However, the range is limited and several choices are inaccurate or unnatural for describing statistical data. “Touching the skyline” and “in peak” are unsuitable expressions here, while “slight control over burglary” suggests crime prevention rather than a change in the chart. There are also noticeable spelling errors, such as “developement,” “liklihood,” and “thw,” which reduce precision. Prefer standard chart language and accurate collocations, for example “the perceived risk fell” and “the actual rate rose slightly.” Avoid decorative introductory phrases that do not describe the figures.
Grammatical Range and Accuracy: Band 5.0
You attempt both simple and more complex sentences, and the main topic is usually understandable. However, control is inconsistent, particularly in sentence boundaries and clause structure. “While actual liklihood was less than 5%” and “While the actual chances of the crime remained same” are dependent clauses presented as complete sentences. The sentence “The likelihood … was 3% … and it with little changes kept same” has an unclear structure, and “between the year 2009 to 2011” uses an incorrect preposition pattern. Articles and verb forms are also sometimes missing or awkward, as in “remained same.” Build complete sentences with a clear subject and verb, and check tense and preposition patterns; for example, “The actual rate remained unchanged” is clearer and grammatically controlled.
See this exact question answered at other band scores. The same prompt compared across bands.
Browse more IELTS Writing model answers or get your own writing scored by the same AI examiner.