Band 6.5 IELTS Writing Task 1 Model Answer
Overall Band Score: 6.5 · IELTS Summit Mastery · 2026-11-19
IELTS Writing Task 1 question
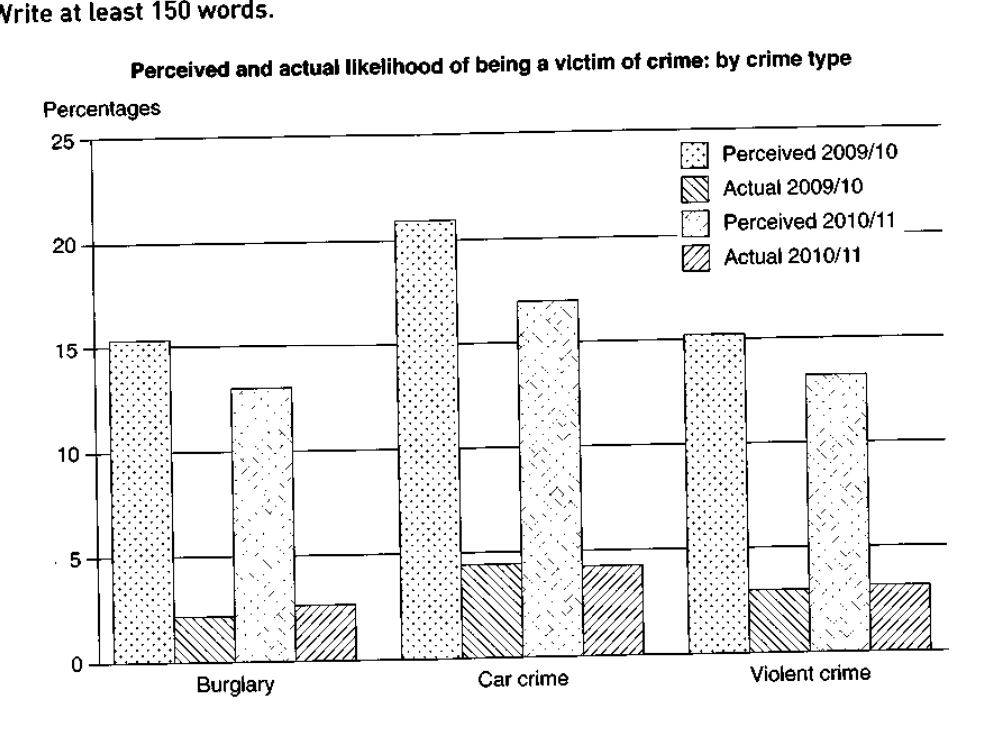
The graph below shows the perceived danger and actual likelihood of being a victim of crime.
Summarise the information by selecting and reporting the main features, and make comparisons where relevant.
Perceived and actual likelihood of being a victim of crime: by crime type
Student answer (Band 6.5)
The bar chart illustrates the perceived danger and actual likelihood of being a crime victim in 2009 and 2010. The data show information in percentages for different crime types, namely burglary, car crime and violent crime.
Overall, it is clear that the proportions of actual crime victim were lower than the perceived danger. It is also noticeable that the car crime ranked first in both percieved danger and actual crime percentages.
To begin with, nearly 15% and 13% of people feel the danger of being a burglary victim in 2009 and 2010, respectively, while almost 2.5 % of people were the actual crime vicitims in these years. Furthermore, in 2009 and 2010, 21% and 17% of people feel the danger of being a car crime victim, reaching the highest figure, while actual car crime victims accounted for nearly 4.5% in both years. Moreover, almost 15% and 13.5% felt the danger of being a violent crime victim while only 2.5 % were the actual victims .
AI examiner evaluation
| Criterion | Band |
|---|---|
| Task Achievement / Task Response | 6.5 |
| Coherence and Cohesion | 7.0 |
| Lexical Resource | 6.0 |
| Grammatical Range and Accuracy | 6.5 |
| Overall | 6.5 |
Task Achievement / Task Response: Band 6.5
You identify the chart’s main contrast accurately: perceived risk is much higher than actual victimisation, and car crime has the highest figures in both measures. The overview and the comparisons across burglary, car crime and violent crime make the response relevant and clear. Most reported values are close to the chart, but the burglary figures are not fully precise: perceived risk is about 15.5% in 2009/10 and 13% in 2010/11, while actual rates are about 2% and 2.5%, rather than one approximate actual figure for both years. The violent-crime actual rates are also about 3% and 3.5%, not 2.5%. More exact year-by-year reporting and a clearer summary of the overall changes would strengthen coverage.
Coherence and Cohesion: Band 7.0
The response is organised in a clear sequence: an introduction, an overview, and a paragraph comparing the three crime types. Linking expressions such as “Overall,” “To begin with,” “Furthermore” and “Moreover” help signal progression, and the reader can follow the comparisons without difficulty. The main limitation is that the final paragraph presents each category in a similar, list-like pattern, rather than grouping related trends or highlighting changes between years. Some transitions are also slightly mechanical. For stronger progression, compare the perceived figures across categories first, then the actual figures, or explicitly connect the small year-to-year changes to the overall contrast.
Lexical Resource: Band 6.0
You use an adequate range of task-related vocabulary, including “perceived danger,” “actual crime victims,” “accounted for” and “highest figure.” These choices make the chart’s subject understandable, and the response attempts some variation rather than relying entirely on basic terms. However, several expressions are imprecise or awkward, such as “feel the danger of being a … victim” and “actual crime victim percentages”; more natural collocations would improve precision. There are also spelling errors in “percieved” and “vicitims,” and the repeated use of “nearly,” “almost” and “people” limits flexibility. Use concise chart language such as “the perceived risk of victimisation” and “the actual victimisation rate.”
Grammatical Range and Accuracy: Band 6.5
You use a mix of simple and more complex sentence forms, including clauses joined with “while,” and most meanings remain clear. The overview is expressed in a straightforward structure, and the longer comparisons generally communicate the intended relationships. Some grammatical errors remain, however. In “the proportions of actual crime victim were lower,” the plural noun phrase needs a plural form such as “victims”; “the car crime ranked first” also needs a more suitable grammatical construction, such as “car crime ranked first.” The sentence beginning “Furthermore, in 2009 and 2010…” is long and would be clearer if divided or carefully balanced. Check articles, number agreement and punctuation around percentage figures to make the comparisons more controlled.
See this exact question answered at other band scores. The same prompt compared across bands.
Browse more IELTS Writing model answers or get your own writing scored by the same AI examiner.