Band 5.0 IELTS Writing Task 1 Model Answer
Overall Band Score: 5.0 · IELTS Summit Mastery · 2026-11-20
IELTS Writing Task 1 question
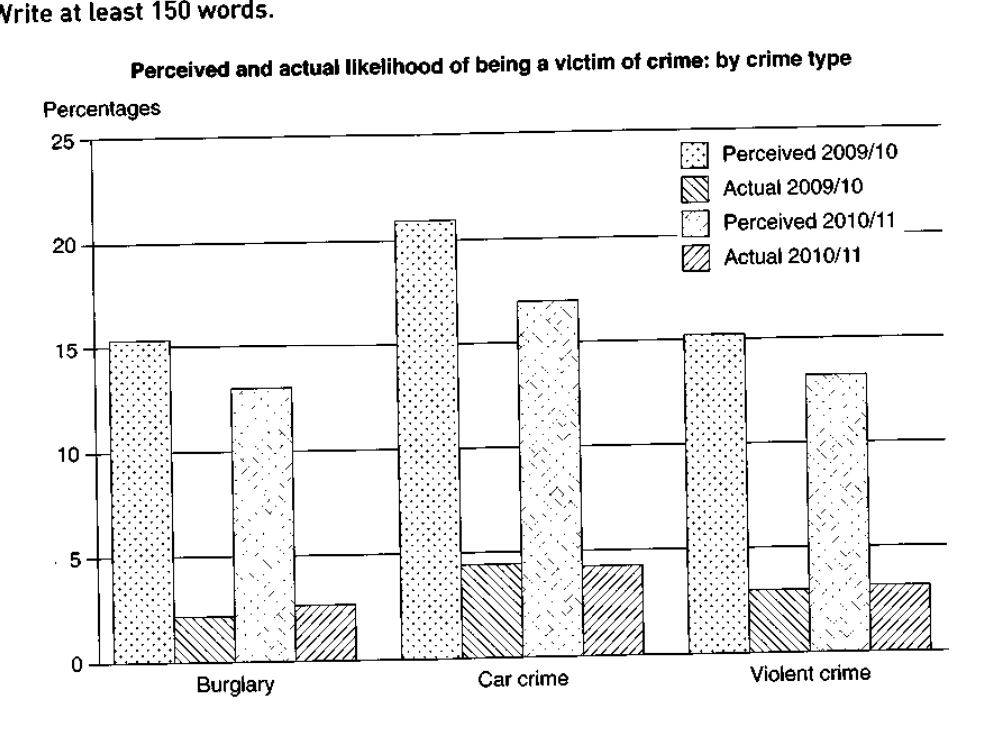
The graph below shows the perceived danger and actual likelihood of being a victim of crime.
Summarise the information by selecting and reporting the main features, and make comparisons where relevant.
Perceived and actual likelihood of being a victim of crime: by crime type
Student answer (Band 5.0)
The bar chart illustrates the perceived and actual likelihood of people becoming victims of three different types of crime in 2009/10 and 2010/11.Most highest percentage of car crime is 20 percent plus at perceived 2009 and 2010 but actual percentage of 4 percent that is very higher than burglary and violent crime.
Overall,car crime had the highest percentage in 2010 and furthermore looking that car crime percentage had totally same with next year. So, at that time Bangladeshi crimer used to try most time this car crime. Although it was not good but other side like voient had very dangerous and harmful crime at that time, not only at that time but also now because it is damage our body and furthermore can waste our parents. So, Voilent crime had 15% parceived in 2009 then after these year percentage came low amount like that 13%. So, after one year it decreased 2%. It was beneficial at that time. So, I'm also looking another crime of burglary is that it had perceived amount 15.1% like that in 2009 but it's was decrease 3% in 2011. However, it was actual rate 3%. It was help our house crime.
In addition car crime is most highest crime in three different crime however violet crime also high than burglary crime.
AI examiner evaluation
| Criterion | Band |
|---|---|
| Task Achievement / Task Response | 5.0 |
| Coherence and Cohesion | 4.5 |
| Lexical Resource | 4.5 |
| Grammatical Range and Accuracy | 5.0 |
| Overall | 5.0 |
Task Achievement / Task Response: Band 5.0
You identify the chart’s subject and make relevant comparisons, including that car crime has the highest perceived figures and that perceived violent crime falls from about 15% to 13%. However, the response only partially reports the main features: it gives little clear account of the actual figures across all three crimes, and the overview is weakened by contradictory claims. For example, you say car crime was “totally same” in the next year, although its perceived figure falls from about 21% to 17%; the actual figure stays around 4.5%. The comments about Bangladeshi criminals, present-day danger and harm to parents are not supported by the chart and distract from the data. Focus on an accurate overview, then compare perceived and actual likelihoods for each crime.
Coherence and Cohesion: Band 4.5
There is some organisation: you begin by introducing the chart, use an overview-like paragraph, and then discuss violent crime, burglary and car crime. However, the progression is difficult to follow because the overview and details are mixed with unsupported commentary, and the final sentence repeats the claim that car crime is highest. Linking words such as “Overall,” “Although,” “So” and “In addition” are used, but several do not show a clear logical relationship between ideas. References such as “at that time” and “these year” are also unclear. A clearer structure would be an introduction, a concise overview of the main patterns, and one or two paragraphs comparing the figures, with each sentence connected directly to the chart.
Lexical Resource: Band 4.5
You use some relevant chart vocabulary, including “perceived,” “actual rate,” “percentage” and “decreased,” so the reader can recognise the topic. However, the range is limited and several word choices or collocations make the meaning unclear: “Most highest percentage,” “totally same,” “help our house crime” and “waste our parents” are not suitable ways to describe the data. There are also repeated forms such as “crime” and “percentage,” while “voient” and “violet” show inaccurate spelling of “violent.” Avoid informal or speculative language about criminals and use precise terms for the chart, such as “the proportion who perceived a risk” and “the actual rate.”
Grammatical Range and Accuracy: Band 5.0
You attempt both simple and longer sentences, and some basic comparisons are understandable, such as “it decreased 2%.” However, errors are frequent, and attempts at more complex sentences are often faulty. Examples include “Most highest percentage of car crime is 20 percent plus,” “car crime percentage had totally same with next year,” and “it was actual rate 3%.” These show problems with sentence structure, articles, verb forms and prepositions. Punctuation also affects readability: there is no space after the full stop in “2010/11.Most,” and commas are often attached to the following word. Build accurate short sentences first, then combine them with controlled clauses such as “while” or “whereas.”
See this exact question answered at other band scores. The same prompt compared across bands.
Browse more IELTS Writing model answers or get your own writing scored by the same AI examiner.