Band 5.5 IELTS Writing Task 1 Model Answer
Overall Band Score: 5.5 · IELTS Summit Mastery · 2026-11-20
IELTS Writing Task 1 question
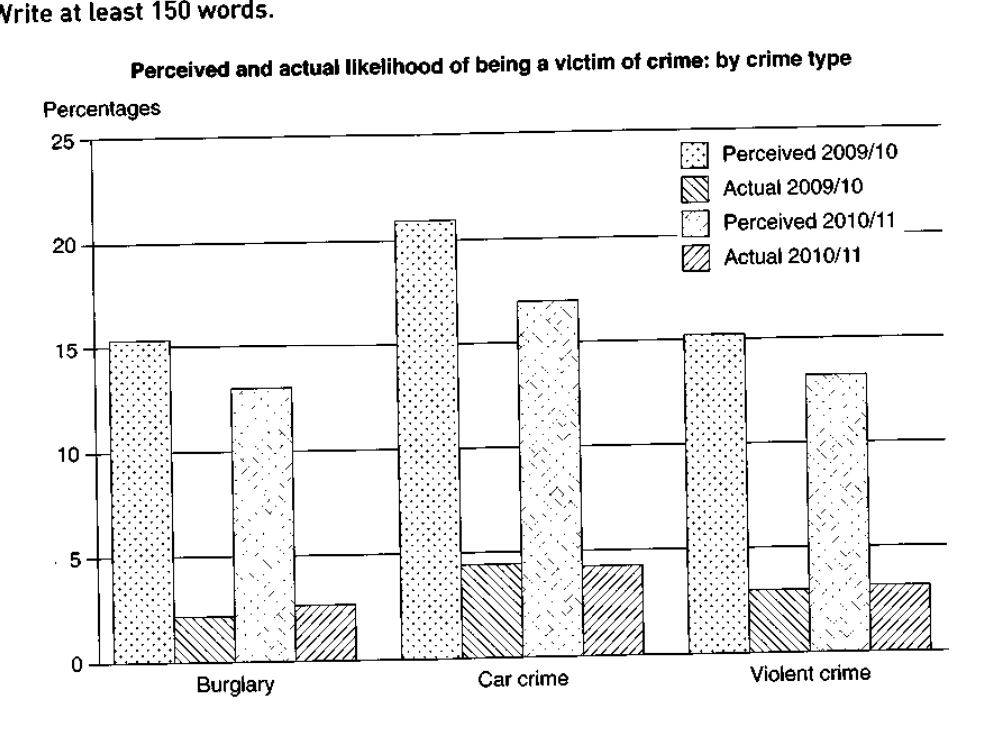
The graph below shows the perceived danger and actual likelihood of being a victim of crime.
Summarise the information by selecting and reporting the main features, and make comparisons where relevant.
Perceived and actual likelihood of being a victim of crime: by crime type
Student answer (Band 5.5)
The bar graph bneath compares the chances of being a victim of crime and danger happened
Overall, from the graph it was seen that there was immense car crime danger followed by burglary and violent crime moreover actual likelihhod of victim is also care crime.
To commence with the perceived danger, car crime outpasses the burglary and violent crime. In 2009/10 the danger accounts for a little more than 20% while in 2010/11 it declines to 17%. However the danger burglary and violent crimes are almost the same For burglary the danger was 15% in 2009/10 which by 2010/11 was in between 10-15%. Finally, the violent crimes in 2009/10 the danger was same as for burglary 15% which in 2010/11 fell by 2-3% same as for burglary.
Secondly, car crime has the substantial likelihood of being a victim almost same in 2009/10 and 2009/11 little less than 5%. Violent crime in 2009/10 have likelihood of being victim by 3-4% followed by burglary which is almost same as for violent crimes.
AI examiner evaluation
| Criterion | Band |
|---|---|
| Task Achievement / Task Response | 5.5 |
| Coherence and Cohesion | 5.5 |
| Lexical Resource | 5.0 |
| Grammatical Range and Accuracy | 5.0 |
| Overall | 5.5 |
Task Achievement / Task Response: Band 5.5
You identify the main broad pattern: perceived risk is much higher than actual victimisation, and car crime is the highest category in both measures. You also report several approximate figures and note that perceived risk declined between the two periods. However, the overview is unclear and partly inaccurate: “immense car crime danger” is imprecise, and the claim that actual likelihood is also highest for car crime needs a clearer comparison. The actual figures for burglary are omitted, and the final paragraph does not compare the two years for violent crime or burglary accurately enough. To strengthen the response, give a concise overview of the large perception–reality gap and the small changes in actual rates, then report the key figures for all three categories.
Coherence and Cohesion: Band 5.5
The response has a recognisable structure, moving from an overview to perceived figures and then actual figures. Paragraphing and signposts such as “To commence with” and “Secondly” help the reader follow the broad categories. However, progression within paragraphs is uneven: the overview combines several points without clearly stating the main comparison, and the actual-data paragraph ends without covering the full set of comparisons. Some links are mechanical or unclear, particularly “moreover actual likelihood of victim is also care crime” and “same as for burglary.” Improve cohesion by grouping each period or measure consistently, using explicit comparisons between perceived and actual rates, and ensuring each reference clearly identifies the crime type and year.
Lexical Resource: Band 5.0
You use some task-relevant vocabulary, including “perceived danger,” “likelihood,” “declines,” and “followed by,” so the reader can identify the topic and general trends. However, the range is limited and several choices are inaccurate or unnatural, which sometimes makes the meaning difficult to follow. For example, “danger happened” does not describe the chart, “outpasses” is not an appropriate comparison verb, and “immense car crime danger” is an awkward way to report a high perceived risk. There are also spelling errors such as “bneath” and “likelihhod.” Use precise chart language such as “was perceived as,” “was higher than,” and “the actual rate,” and check spelling and collocations carefully.
Grammatical Range and Accuracy: Band 5.0
You attempt both simple and longer sentences, and the response generally communicates the categories and broad direction of change. However, control is inconsistent, with frequent errors in sentence structure, verb forms, agreement, and punctuation. For example, “The bar graph bneath compares the chances of being a victim of crime and danger happened” is not a complete, well-formed description, while “Violent crime in 2009/10 have likelihood” has incorrect subject–verb agreement and an awkward construction. Several sentences run together or lack punctuation, as in the comparison of burglary and violent crime. Practise writing clear subject–verb sentences, use past-tense forms consistently when describing the chart, and separate comparisons with full stops or commas.
See this exact question answered at other band scores. The same prompt compared across bands.
Browse more IELTS Writing model answers or get your own writing scored by the same AI examiner.