Band 4.5 IELTS Writing Task 1 Model Answer
Overall Band Score: 4.5 · IELTS Summit Mastery · 2026-11-20
IELTS Writing Task 1 question
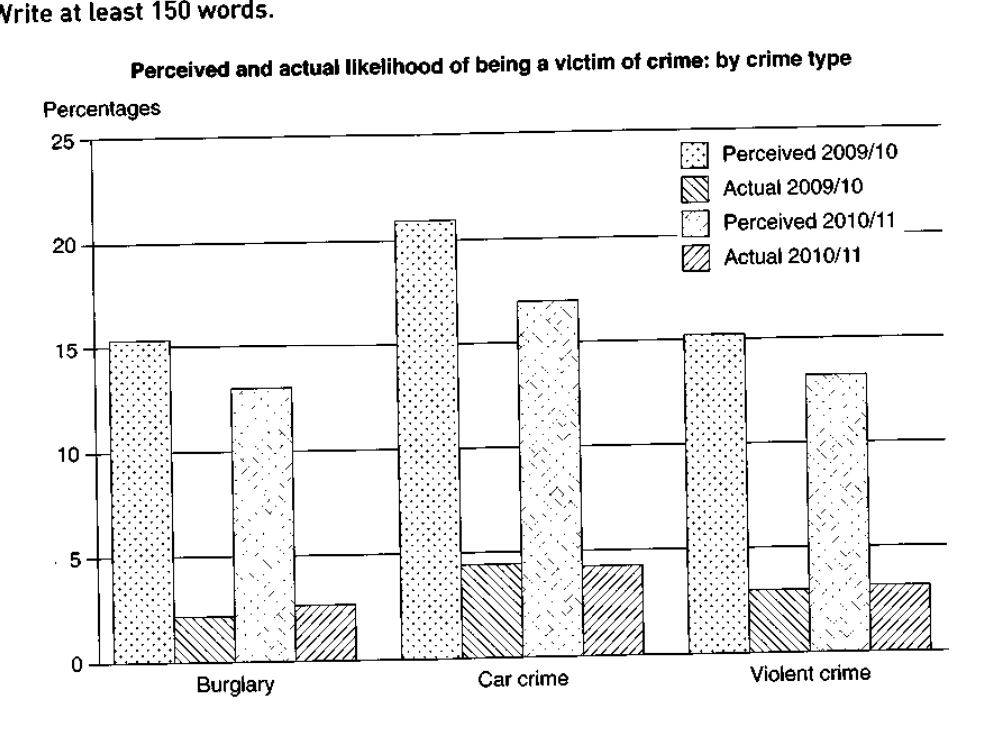
The graph below shows the perceived danger and actual likelihood of being a victim of crime.
Summarise the information by selecting and reporting the main features, and make comparisons where relevant.
Perceived and actual likelihood of being a victim of crime: by crime type
Student answer (Band 4.5)
"The graph illustrates the perceived threatened and actual likelihood of being
victim of crime.The highest figure is car crime 22%perceived 2009/10.
The lowest figure is voilent crime 3% perceived 2010/11.
Initally,the car crime accounted for 22%higher in perceived 2009/11.
and decreases accounted for 16%lower in
actual 2010/11.And the car crime was higher than voilent crime.
Secondly, burgalary accounted for 15%in perceived 2009/10.While,the brugary is 13% lower
in percevied 2010/11.Furthermore,burgalary stood at 4%in actual 2009/10
And the buglary was lower than car crime.
Finally,the violent crime is increased 15%in perceived 2009/10.and then 3%in actual 2009/10
and slightlhy increases proportion of 4%in actual 2010/11.
These were the different perceived and actual likelihood of being a victim of crime types
among different proprtions of burglary,car crime and violent crime in perceived 2009/10,
Actual 2009/10,Perceived 2010/11 and actual 2010/11.However,the car rates of actual
likelihood of being of victim of crime was more in perceived 2009/10
and voilence crime is not so much more in perceived 2010/11.
AI examiner evaluation
| Criterion | Band |
|---|---|
| Task Achievement / Task Response | 4.5 |
| Coherence and Cohesion | 4.0 |
| Lexical Resource | 5.0 |
| Grammatical Range and Accuracy | 4.5 |
| Overall | 4.5 |
Task Achievement / Task Response: Band 4.5
You identify the chart’s subject and make some relevant comparisons, including that perceived car-crime risk was highest in 2009/10 and that perceived figures were generally much higher than actual figures. However, the overview is unclear and several key details are inaccurate or incomplete. For example, the lowest figure is actual burglary at about 2% in 2009/10, not perceived violent crime at 3%; perceived car crime in 2010/11 was about 17%, not 16%; and actual burglary was about 2–2.5%, not 4%. The response also does not clearly summarise the overall pattern across both years. Focus on accurate headline trends, then select a few reliable comparisons to support them.
Coherence and Cohesion: Band 4.0
There is an attempt to organise the response with “Initially,” “Secondly,” and “Finally,” and the writing refers to all three crime types. However, the progression is difficult to follow because the comparisons shift between perceived and actual figures without a clear organising principle. Several statements are isolated or incomplete, such as “and decreases accounted for 16% lower in actual 2010/11,” while the final paragraph repeats the chart categories rather than drawing the information together. Paragraphing and sentence boundaries are also inconsistent. A clearer structure would be an introduction, a concise overview, and two comparison paragraphs grouped by perceived and actual likelihood, with linking phrases that make each comparison explicit.
Lexical Resource: Band 5.0
The response uses some relevant chart vocabulary, including “accounted for,” “stood at,” “figure,” and “proportion,” and it attempts to describe increases and decreases. However, the range is limited and several word choices or collocations are inaccurate, which sometimes makes the meaning difficult to interpret. For instance, “perceived threatened” is not a natural description of the measure, and “22% higher in perceived” does not clearly express a percentage value. There are also repeated spelling errors in words such as “violent,” “burglary,” and “initially.” Use precise terms such as “perceived likelihood,” “actual rate,” and “fell to,” and check spelling carefully. Avoid using “accounted for” when simply reporting a percentage.
Grammatical Range and Accuracy: Band 4.5
You attempt both simple statements and longer sentences, but control is inconsistent, and errors frequently make relationships between figures unclear. Examples include “The highest figure is car crime 22%perceived 2009/10,” which lacks a clear grammatical link between the category, value, and year, and “the car crime accounted for 22%higher,” where the comparison structure is faulty. Verb forms and sentence boundaries also need attention: “the violent crime is increased” and the run-on sequence beginning “Finally” should be revised. Articles, punctuation, and spacing are often missing or inconsistent. Practise writing complete sentences with a clear subject and verb, for example, “Perceived concern about car crime fell from about 21% to 17%.”
See this exact question answered at other band scores. The same prompt compared across bands.
Browse more IELTS Writing model answers or get your own writing scored by the same AI examiner.