Band 5.5 IELTS Writing Task 1 Model Answer
Overall Band Score: 5.5 · IELTS Summit Mastery · 2026-11-20
IELTS Writing Task 1 question
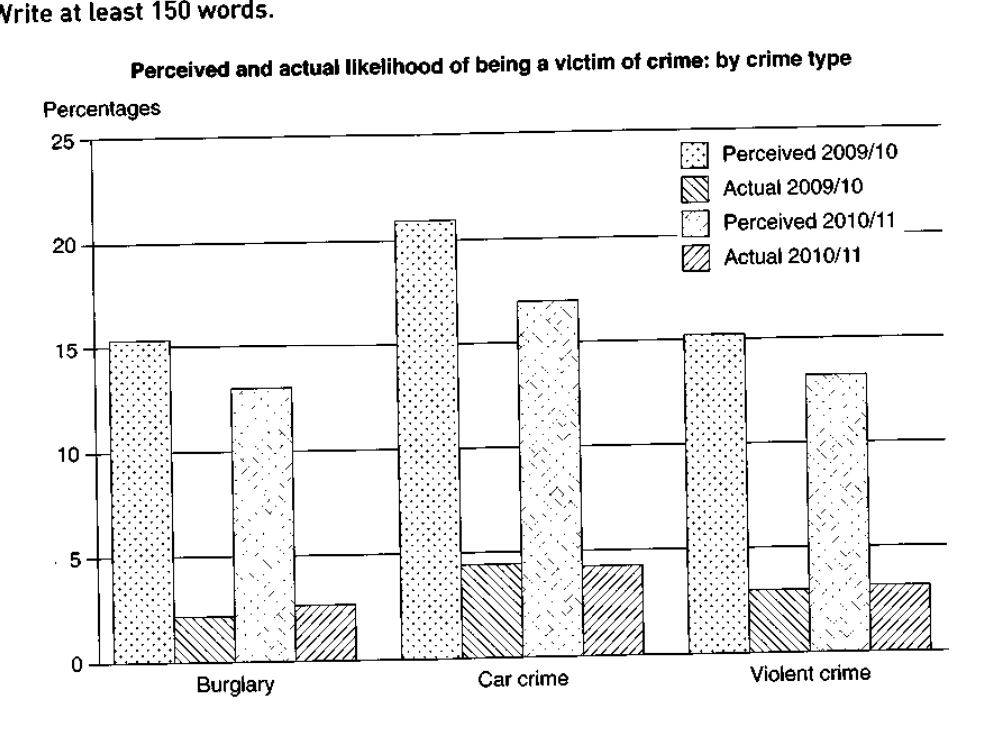
The graph below shows the perceived danger and actual likelihood of being a victim of crime.
Summarise the information by selecting and reporting the main features, and make comparisons where relevant.
Perceived and actual likelihood of being a victim of crime: by crime type
Student answer (Band 5.5)
The bar chart illustrates the perceived danger to the actual likehood of falling victim to three categories of crime over two distinct period 2009/10 and 2010/11.
According to the graph, in 2009/10, the perceived danger for car crime peacked at roughly 21%, whereas the actual likehood was only around 4%. Although the perceived fear dropped slighly to 17% in 2010/11, the actual crime rate saw a rise to approximately 3%. Similarly, The percentage of perceived danger of bulgary stood at 15% in 2009/0 ,in the same year the figure for actual likehood decreased gradually to nearly 2%. Subsequently, in the year 2010/11 the perceived danger of bulgary accounted for approximately 13%, which slighly increased for actual likehood at 3%.
Following to this, violent crime for perceived danger in 2009/10 experience at 15%, which showed downward tred for actual fear at 3%. In addition, perceived danger stood at 14% in 2009/10, while this figure fell to just 3% for actual likehood.
Oveall, perceived danger for car crime showed highes fear in during all the periods, whereas others two crime had similiar percentage for perceived danger and for actual likehood.
AI examiner evaluation
| Criterion | Band |
|---|---|
| Task Achievement / Task Response | 5.5 |
| Coherence and Cohesion | 5.5 |
| Lexical Resource | 5.5 |
| Grammatical Range and Accuracy | 5.0 |
| Overall | 5.5 |
Task Achievement / Task Response: Band 5.5
You identify the chart’s main contrast: perceived risk is much higher than actual victimisation, and car crime has the highest perceived figure. However, the overview is imprecise: saying the other two categories had “similar percentage” does not clearly summarise the pattern across both measures and years. Several details are also inaccurate or unclear. For example, burglary’s actual figure rises from about 2% to 2.5%, not to 3%, while violent crime’s perceived figure falls from about 15.5% to 13.5%; the final sentence instead gives 14% and confusingly compares it with an actual figure. The response selects relevant data, but incomplete comparisons and misreported figures limit how fully it reports the chart.
Coherence and Cohesion: Band 5.5
The response has an introduction, a sequence of comparisons, and a concluding overview, so there is some overall organisation. It also uses linking expressions such as “Although,” “Similarly,” and “In addition.” However, the progression is difficult to follow because the discussion shifts between crime types and years without a consistent structure. The phrase “Following to this” does not clearly signal the next comparison, and “in the same year” is attached to a sentence whose figures are hard to distinguish. The final overview repeats the car-crime point but does not resolve the unclear comparisons. Organise the body by crime type or by year, and use clear references to distinguish perceived from actual figures.
Lexical Resource: Band 5.5
You attempt a range of chart-related vocabulary, including “perceived danger,” “actual likelihood,” “peaked,” “dropped,” and “accounted for.” These choices show an effort to describe changes and compare measures. However, several spelling errors and awkward or inaccurate collocations make the account less clear, including “likehood,” “bulgary,” “actual fear,” and “showed downward tred.” “Actual crime rate” is also not quite the same as the chart’s measure of actual likelihood of victimisation. Use accurate, consistent terms for the two series and check spelling carefully. More precise verbs such as “stood at,” “declined,” and “increased” would help you report the figures naturally.
Grammatical Range and Accuracy: Band 5.0
You attempt both simple and more complex sentences, including a contrast clause beginning “Although” and a relative clause in “which showed downward tred.” However, errors are frequent and sometimes make relationships between figures difficult to understand. Examples include “over two distinct period,” “the perceived danger … peacked,” and “violent crime … experience at 15%,” where number agreement and verb forms are faulty. Some sentence boundaries and punctuation are also problematic, as in “2009/0 ,in the same year,” while the final sentence has an unclear comparison structure. Practise accurate past-tense reporting and agreement, and build shorter, clearly structured comparisons before adding subordinate clauses.
See this exact question answered at other band scores. The same prompt compared across bands.
Browse more IELTS Writing model answers or get your own writing scored by the same AI examiner.