Band 4.0 IELTS Writing Task 1 Model Answer
Overall Band Score: 4.0 · IELTS Summit Mastery · 2026-11-20
IELTS Writing Task 1 question
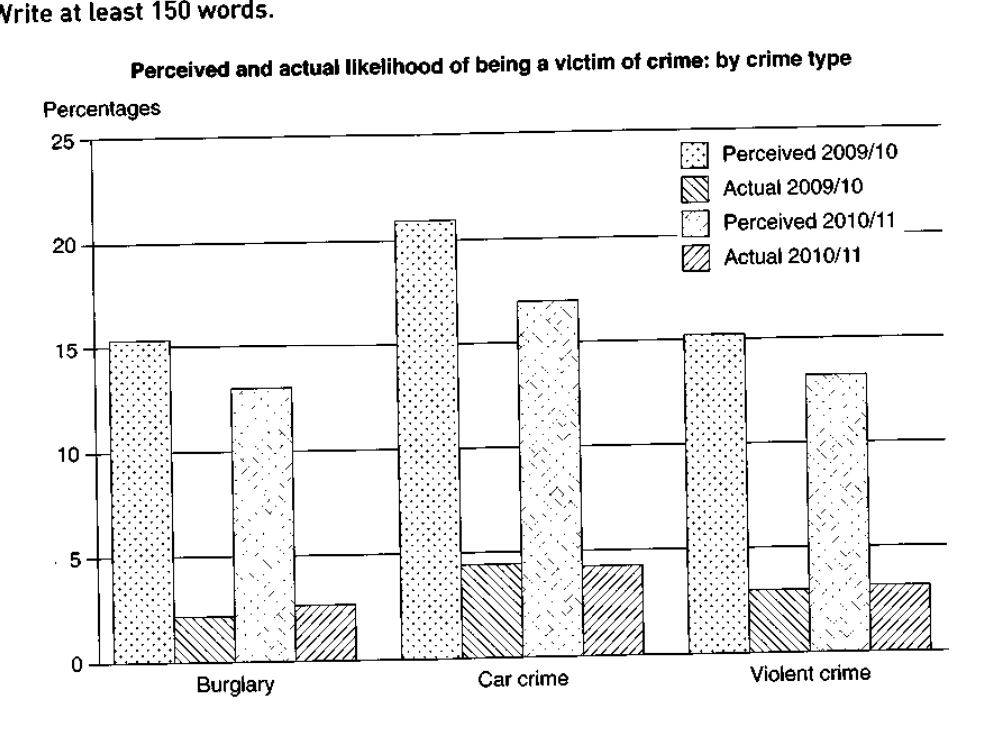
The graph below shows the perceived danger and actual likelihood of being a victim of crime.
Summarise the information by selecting and reporting the main features, and make comparisons where relevant.
Perceived and actual likelihood of being a victim of crime: by crime type
Student answer (Band 4.0)
the picture is showing perceived and actual likelihood of being a victim of crime by crime type percentages. in which showing percentages … 0 , 5 ,10 , 15 , 20 , 25 and also showing crime type … in which three types to crime the first is burglary , second is car crime and the last one is violet crime . precevied 2009/10 with dot , actual 2009/10 with right side line , and then precevied 2010/11 with light small lines and the last one is again actual 2010/11 with left side line . one of the most high crime is car crime approximately 21. it is precevied 2009/10 , actual 2009/10 approximately 4. and then perceived 2010/11 approximately 17 and actual 2010/11 approximatel 4 .
AI examiner evaluation
| Criterion | Band |
|---|---|
| Task Achievement / Task Response | 3.5 |
| Coherence and Cohesion | 3.5 |
| Lexical Resource | 4.5 |
| Grammatical Range and Accuracy | 4.5 |
| Overall | 4.0 |
Task Achievement / Task Response: Band 3.5
You identify the chart’s subject and mention all three crime types, and your car-crime figures broadly reflect the chart. However, the response does not provide a clear overview of the main patterns: for example, it does not state that perceived risk is much higher than actual victimisation for every crime type, or that car crime is highest in both measures. Coverage is also very limited: most figures for burglary and violent crime are omitted, and the actual car-crime values are given as approximately 4 rather than about 4.5. The response contains 114 words, below the required 150, which further limits the detail reported. To improve, write a concise overview and compare the two years across all categories using selected accurate figures.
Coherence and Cohesion: Band 3.5
There is a basic sequence: you introduce the chart, describe its labels and legend, then focus on car crime. This gives the reader some sense of the topic, but the response lacks paragraphing and a clear progression from an overview to comparisons and supporting details. The long opening sentence lists axis labels and line styles, which takes space without helping explain the data. Connections between points are also weak; repeated phrases such as “and then” do not clearly show whether figures are being compared across years or between perceived and actual risk. Organise the response into an introduction, an overview, and a short details paragraph, using links such as “by contrast” and “in both years” to make relationships explicit.
Lexical Resource: Band 4.5
You use some relevant chart vocabulary, including “percentages,” “crime type,” “approximately,” and “perceived” and “actual,” so the reader can recognise the subject and some data. However, the range is narrow and several words are inaccurate or repeatedly misspelled, including “precevied” and “violet” for “violent.” Phrases such as “one of the most high crime” are not natural ways to describe a chart, and “picture” is less precise than “bar chart.” The descriptions of the legend as “right side line” and “left side line” are also unclear. Build a small set of accurate reporting expressions, such as “the highest figure,” “the actual rate,” and “fell from … to …,” and check spelling carefully.
Grammatical Range and Accuracy: Band 4.5
The response communicates its general topic through short clauses and some simple sentence patterns, but grammatical control is inconsistent. Several fragments lack a main verb, for example, “in which showing percentages” and “precevied 2009/10 with dot.” The opening also has an incomplete construction: “the picture is showing … in which showing.” Sentence boundaries and punctuation are difficult to follow, particularly in the long final sequence of figures. There is little variety in sentence structure, so comparisons are not expressed clearly. Practise complete sentences with a subject and verb, such as “The chart compares perceived and actual risk in two years,” followed by accurate comparative clauses. Use full stops to separate the overview from individual data comparisons.
See this exact question answered at other band scores. The same prompt compared across bands.
Browse more IELTS Writing model answers or get your own writing scored by the same AI examiner.