Band 6.0 IELTS Writing Task 1 Model Answer
Overall Band Score: 6.0 · IELTS Summit Mastery · 2026-11-21
IELTS Writing Task 1 question
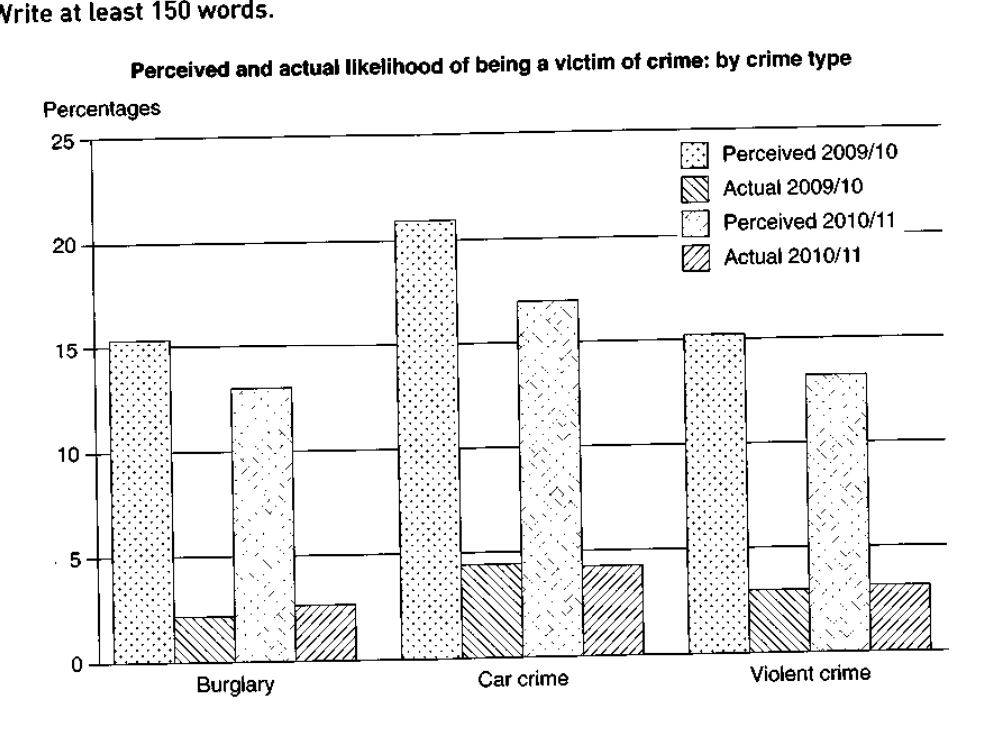
The graph below shows the perceived danger and actual likelihood of being a victim of crime.
Summarise the information by selecting and reporting the main features, and make comparisons where relevant.
Perceived and actual likelihood of being a victim of crime: by crime type
Student answer (Band 6.0)
The graph illustrate the difference between the perceived danger and actual likelihood of being a victim of different types of crime.
Overall, for every crime listed the perceived crime is always higher than the actual crime rate. The highest percentage of percieved crime for both years is car crime and it is also highest for the actual crime rate. For 2009/10 both burglary and violent were exact same for perceived crime but in actual violent crime was a little higher than burglary and the same pattern is seen for year 2010/11 for both violent crime and burglary.
The car crime percieved was highest for both years with 21% and 17%.But the actual was way less with 4% and 3%.Burglary percieved for both years was 15% and 13% but their actual rate was 2% and 2.5%. In car crime there is a greater difference between perceived and actual than the other two crimes with almost 17% decline from perceived to actual for 2009/10 and 14% decline for year 2010/11.
In violent crime, perceived was 15% and the actual crime was 2.5% for year 2009/10 and for year 2010/11 the perceived was around 14% but the actual crime was a little higher than 2.5%.The difference for both years was around 12.5% and 11.5%.
AI examiner evaluation
| Criterion | Band |
|---|---|
| Task Achievement / Task Response | 6.0 |
| Coherence and Cohesion | 6.0 |
| Lexical Resource | 5.5 |
| Grammatical Range and Accuracy | 5.5 |
| Overall | 6.0 |
Task Achievement / Task Response: Band 6.0
The response identifies the main overall pattern: perceived risk is higher than actual victimisation for all three crimes, and car crime is highest in both measures. It also compares the two years and notes the close relationship between burglary and violent crime. However, some figures are inaccurate: actual car crime is about 4.5% in both years, not 4% and 3%, and actual violent crime is about 3% and 3.5%, rather than 2.5% and a little above that. The stated gaps for car crime are therefore also overstated. The overview is relevant, but the comparisons would be more reliable with closer reporting of the chart’s values and clearer emphasis on the general fall in perceived risk.
Coherence and Cohesion: Band 6.0
The response has a clear overall arrangement, moving from an introduction and overview to details about car crime, burglary and violent crime. Paragraphing helps distinguish the main summary from the figures, and linking expressions such as “Overall,” “but” and “for both years” make the comparisons understandable. However, the progression within the detail paragraphs is not always smooth: the discussion shifts between crime types and year comparisons, and repeated use of “for both years” makes the organisation somewhat mechanical. Some references, such as “the same pattern,” require the reader to infer exactly which figures are being compared. Grouping the data more consistently by perceived versus actual rates, or by year, would make the comparisons easier to follow.
Lexical Resource: Band 5.5
The response uses enough relevant vocabulary to describe the chart, including “perceived,” “actual,” “percentage,” “higher” and “difference.” These choices generally communicate the intended comparisons. However, the range is somewhat repetitive, especially with repeated use of “crime,” “was” and “higher,” and some expressions are imprecise or informal for an academic summary, such as “way less” and “a little higher.” There are also spelling errors in “percieved” and “percieved” again, which detract from control. More precise chart language would help distinguish rates, proportions and gaps, while varied verbs such as “stood at,” “declined” and “exceeded” would make the account more concise and appropriately formal.
Grammatical Range and Accuracy: Band 5.5
The response includes a mix of simple statements and more complex comparisons, for example, “Overall, for every crime listed the perceived crime is always higher than the actual crime rate.” Most of the meaning remains clear, but some grammatical errors recur. The opening should be “The graph illustrates,” and “both burglary and violent were exact same” needs a complete, correctly formed comparison, such as “the perceived figures for burglary and violent crime were identical.” There are also missing spaces after full stops, as in “17%.But” and “2.5%.The,” and punctuation around clauses is sometimes weak. Improving subject–verb agreement, sentence completeness and punctuation would make the varied structures more accurate and easier to read.
See this exact question answered at other band scores. The same prompt compared across bands.
Browse more IELTS Writing model answers or get your own writing scored by the same AI examiner.