Band 5.0 IELTS Writing Task 1 Model Answer
Overall Band Score: 5.0 · Cambridge IELTS 17 · 2026-11-16
IELTS Writing Task 1 question
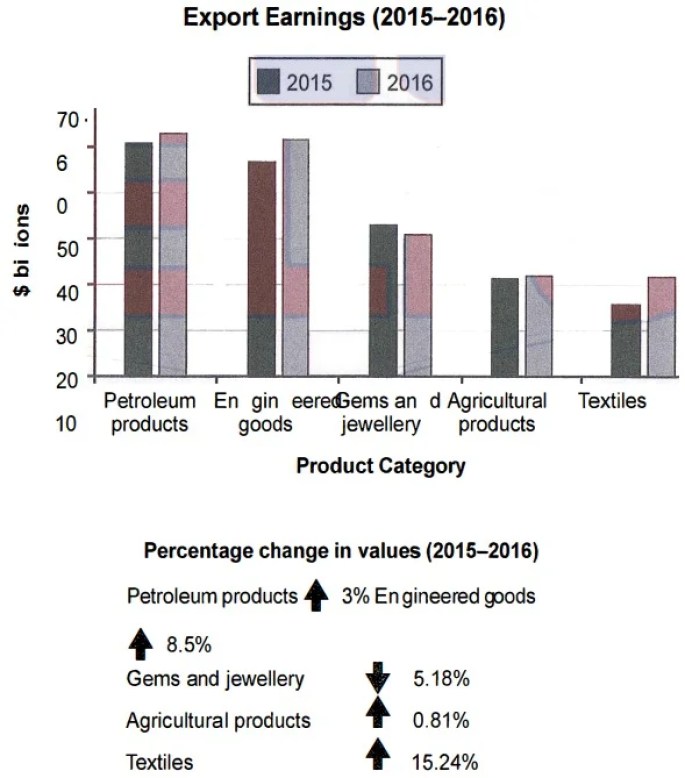
below shows the value of one country’s exports in various categories during 2015 and 2016. The table shows the percentage change in each category of exports in 2016 compared with 2015.
Summarise the information by selecting and reporting the main features, and make comparisons where relevant.
Student answer (Band 5.0)
The bar chart compare the exports earnings in one specific countries of five items during 2015 and 2016 and the table illustrate the how much percentage change in values.Figures are given in billions.
Overall, the boggest share in the chart is petroleum products and its shows the lowest share is textiles.
In 2015 Petroleum products was the heighest proportion, 60 billions which increased gradually in 2016 to 63 billions. Engieering goods was in the second position in 2015, 55 billions which is also increased in 2016 up to 60 billions. Ob the other hand , the value for gems and jewellary in 2015 40 billions and it declined in 2016 which is 39 billions. In term of agriculture products 2015 and 2016 was remain same, 30 billions that was similar like textile in 2016 and textile in 2015 around 25 billions.
The upwards rate 8.5 % in petroleum products, 3% in engineering goods. Rest of the products value were delined gradually.
AI examiner evaluation
| Criterion | Band |
|---|---|
| Task Achievement / Task Response | 4.5 |
| Coherence and Cohesion | 5.5 |
| Lexical Resource | 5.0 |
| Grammatical Range and Accuracy | 5.0 |
| Overall | 5.0 |
Task Achievement / Task Response: Band 4.5
You identify the chart’s subject and make an attempt at an overview by noting that petroleum products are the largest category. However, the overview is inaccurate: textiles are not the lowest in 2016, as agricultural products are also about $31 billion, and the claim that textiles are the lowest does not capture the main pattern. Several figures and trends are misreported: engineered goods rose from about $57 billion to $62 billion, while gems and jewellery fell from about $43 billion to $41 billion. The final paragraph also assigns the percentage changes incorrectly and says the remaining categories declined, although most increased. To improve, select the main rises and fall accurately and support the overview with correctly matched figures.
Coherence and Cohesion: Band 5.5
The response has a recognisable structure: an introduction, an overview, a paragraph describing the chart, and a final sentence about percentage changes. This gives the reader some organisation. However, progression is weakened because the final sentence introduces percentage changes without clearly linking them to the categories, and it contradicts the earlier account of trends. Connectors such as “On the other hand” and “In term of” show an attempt to guide the reader, but the relationships between ideas are not always clear. Group the main increases together, then describe the decline and near-stable category, and use accurate references such as “the former” or repeat the category name where needed.
Lexical Resource: Band 5.0
You use some task-related vocabulary, including “exports,” “percentage change,” “declined,” and “increased,” so the topic is generally identifiable. However, the range is limited and several word-choice, spelling, and collocation errors make parts less clear. Examples include “boggest share,” “heighest proportion,” “Engieering goods,” and “jewellary”; “share” and “proportion” are also not the clearest terms for values measured in billions. Phrases such as “upwards rate” and “delined gradually” do not express the intended data accurately. Build a more precise set of chart terms, such as “export earnings,” “rose by,” “fell to,” and “remained stable,” and check spelling before submitting.
Grammatical Range and Accuracy: Band 5.0
You attempt both simple and more extended sentences, and the reader can usually identify the categories being discussed. However, grammatical errors occur frequently and sometimes make relationships difficult to follow. For example, “The bar chart compare” has subject–verb disagreement, while “its shows” and “which is also increased” use incorrect verb forms. Articles and sentence construction are also problematic in “the table illustrate the how much percentage change” and “In term of agriculture products 2015 and 2016 was remain same.” Work on consistent past-tense reporting, subject–verb agreement, and complete sentence patterns. For instance, write “The value of agricultural products remained the same in both years” to express that comparison clearly.
See this exact question answered at other band scores. The same prompt compared across bands.
Browse more IELTS Writing model answers or get your own writing scored by the same AI examiner.